EUR/GBP trading blueprint: From analysis to profitable execution

The charts provided by the analyst focus on the relationship between the Euro and the Pound Sterling, both directly (EUR/GBP) and indirectly (relative strength of EUR/USD vs. GBP/USD).
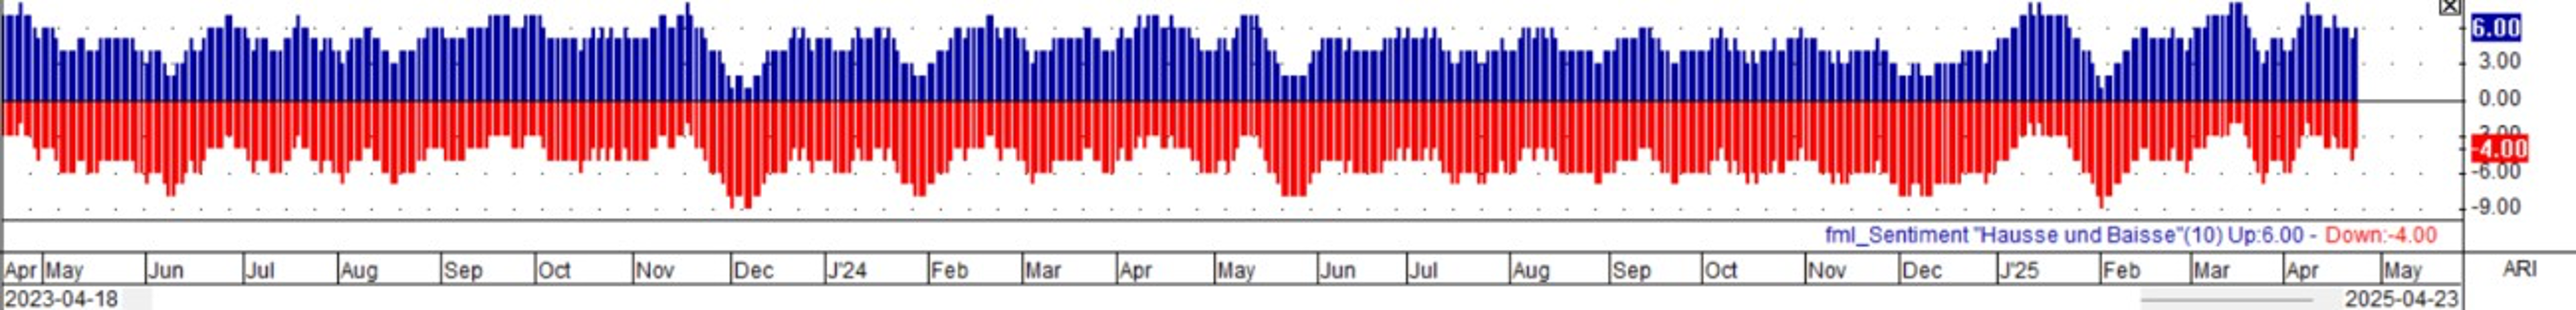
This approach allows for a multi-faceted perspective on the currency pair's dynamics. The charts enable observation of price action across long and short timeframes, volatility, and sentiment indicators.
Analysis and inferences

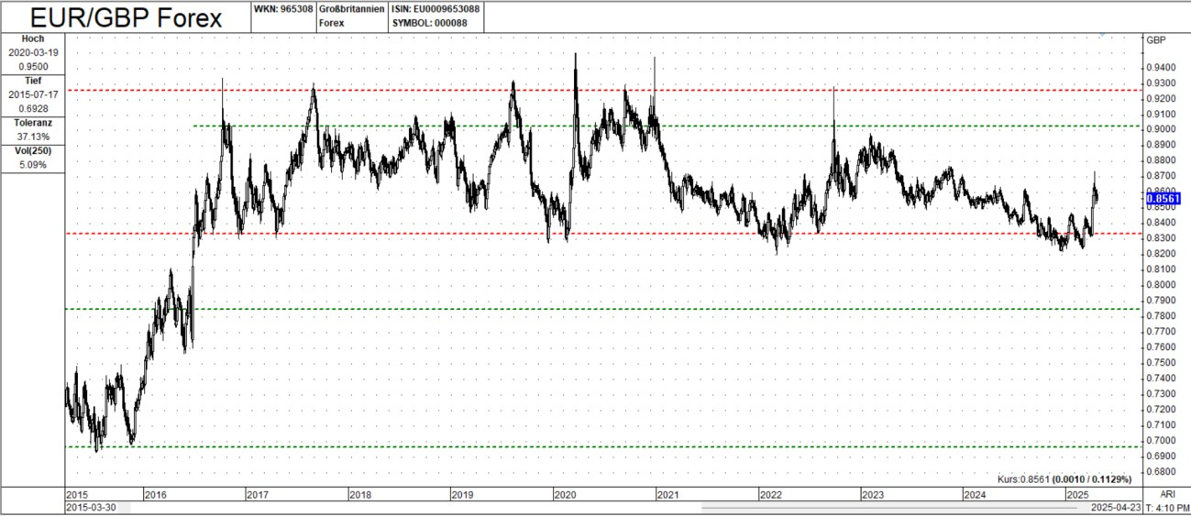
Range-bound behavior: Both charts reveal that EUR/GBP has exhibited a range-bound pattern over the years. Key support and resistance levels are apparent, suggesting periods of consolidation and mean reversion. This range-bound behavior implies that fundamental factors influencing the Euro and the Pound have, over the long term, created equilibrium points. Traders might exploit these ranges using strategies like buying at support and selling at resistance.
Short-term dynamics
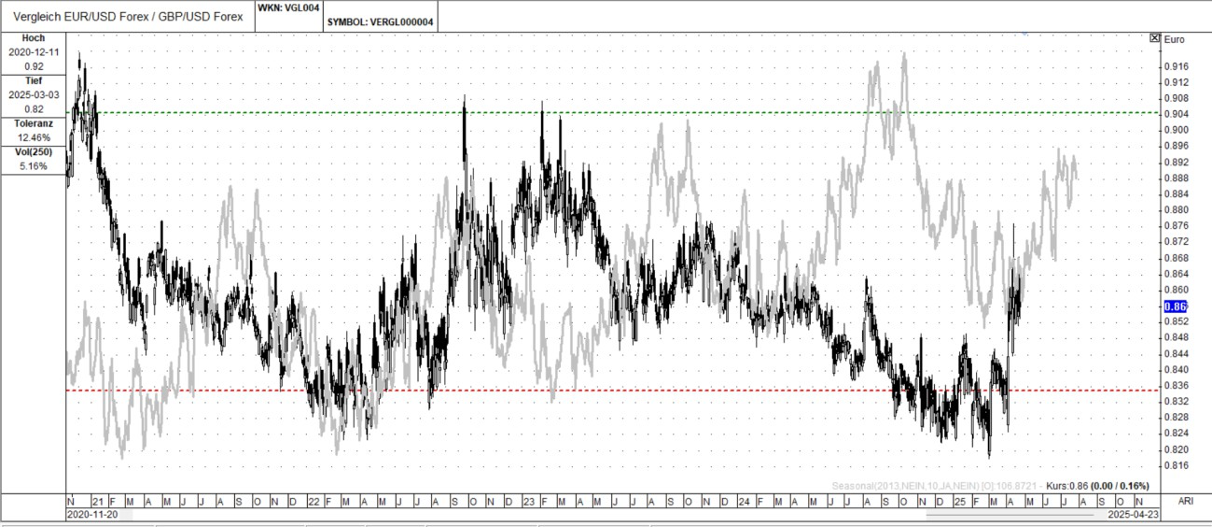
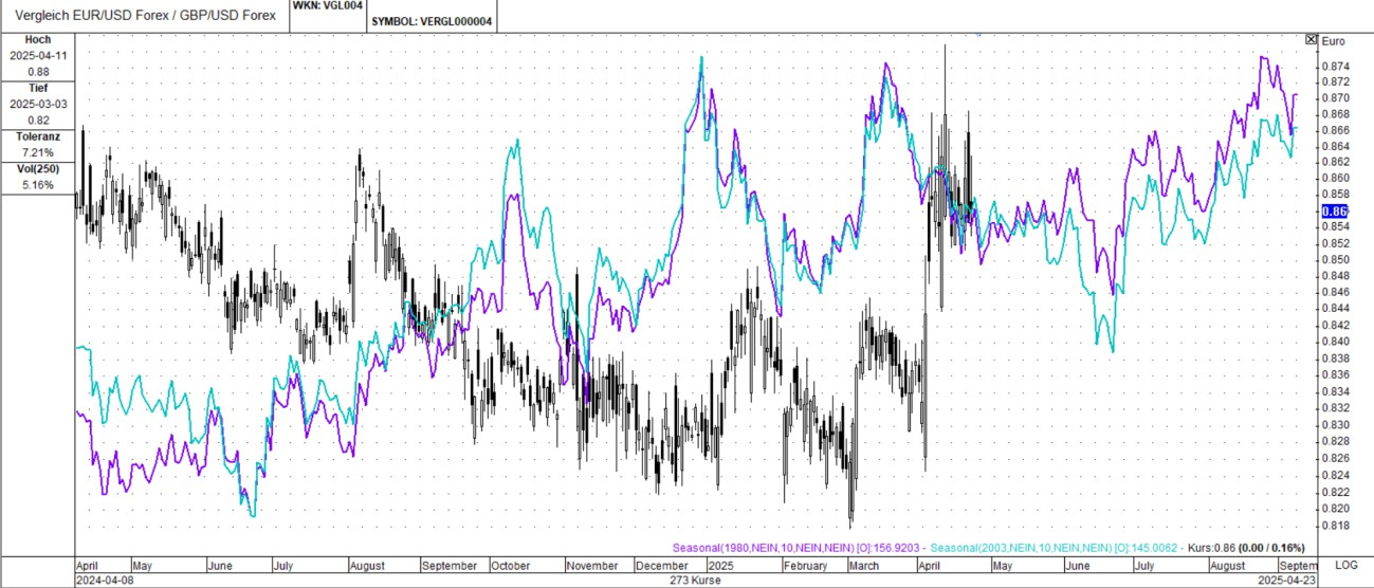
The Charts above provide a closer look at the relative strength of EUR/USD vs. GBP/USD over shorter periods. They highlight the volatility and the shifting momentum between the two currencies. The volatility (Vol250) values are relatively consistent across the charts, suggesting a degree of stability in the medium-term volatility of the EUR/GBP pair. This stability can be useful for position sizing and risk management, allowing traders to set appropriate stop-loss levels and profit targets.
Inferences and potential recommendations:
Given the long-term range-bound behavior, consider a range trading strategy. Buy EUR/GBP near established support levels and sell near resistance. Use appropriate stop-loss orders to manage risk in case the range breaks down.
Relative strength charts can be used to confirm signals from the direct EUR/GBP chart. For example, if EUR/GBP is approaching support, look for a corresponding uptick in the relative strength of EUR/USD vs. GBP/USD as additional confirmation of a potential bounce.
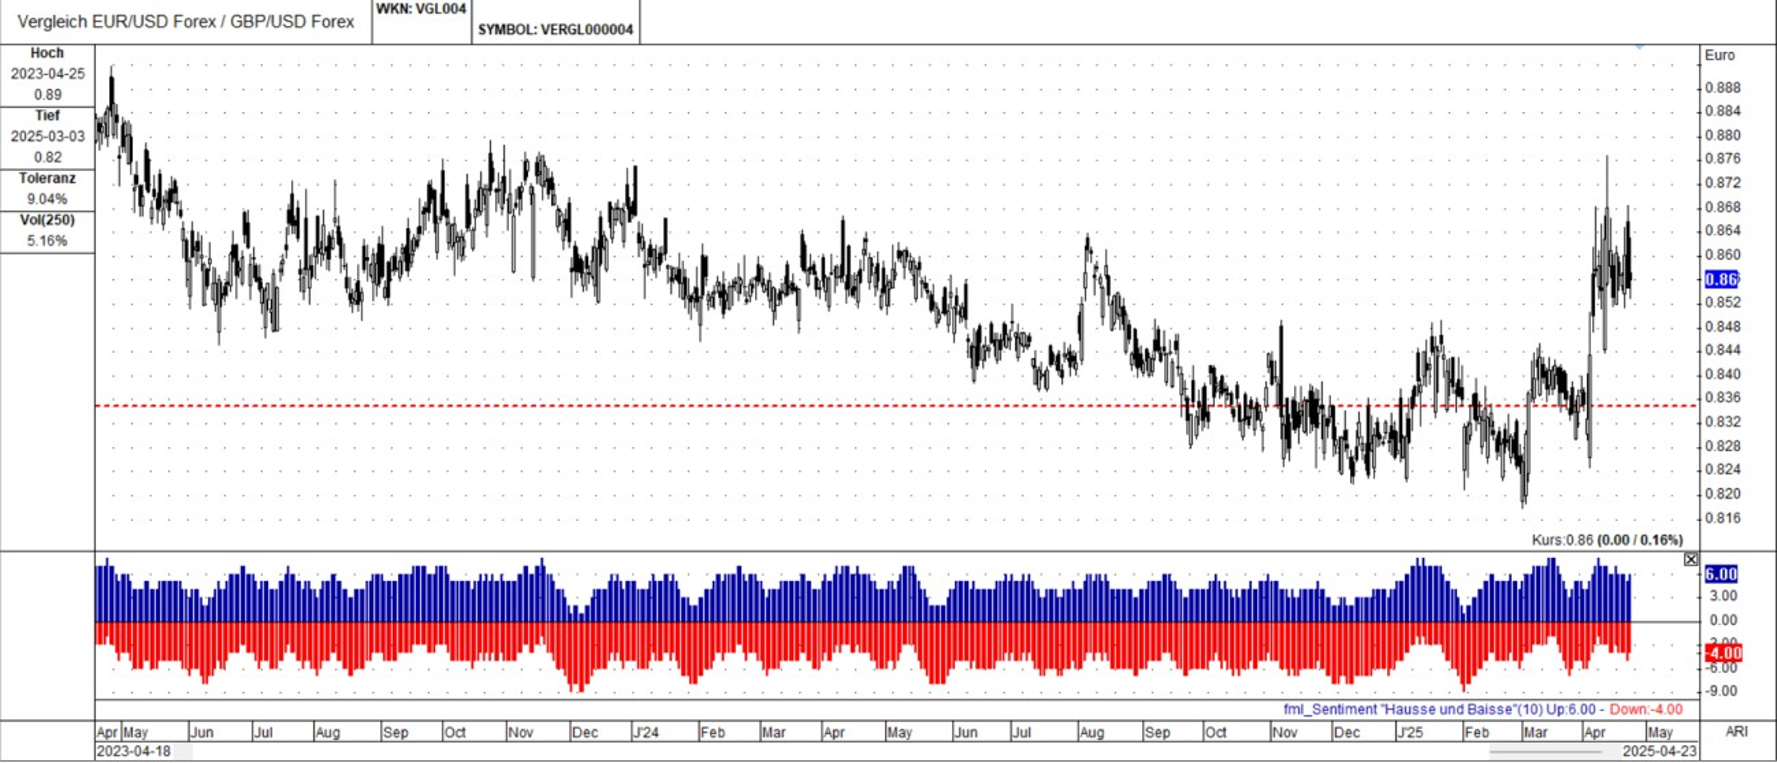
Bullish sentiment combined with a breakout above short-term resistance could signal a strong buying opportunity. Conversely, bearish sentiment near resistance might warrant selling or
taking profits on long positions. Higher volatility generally necessitates smaller position sizes and wider stop-loss levels, while consistent volatility allows for more predictable risk assessment.
It's crucial to remember that fundamental factors such as economic data releases, central bank policies, and geopolitical events can significantly influence the EUR/GBP pair. Given that the provided charts offer only a snapshot in time, continuous monitoring and regular analysis updates are strongly recommended.
Author

FxPro Traders Research Team
FxPro Traders
The FxPro Traders Research Team delivers advanced analysis and strategies designed to empower your success in today's dynamic forex markets.


