|

Elliott Wave View: Nasdaq (NQ_F) 5 swing bearish sequence favors more downside [Video]

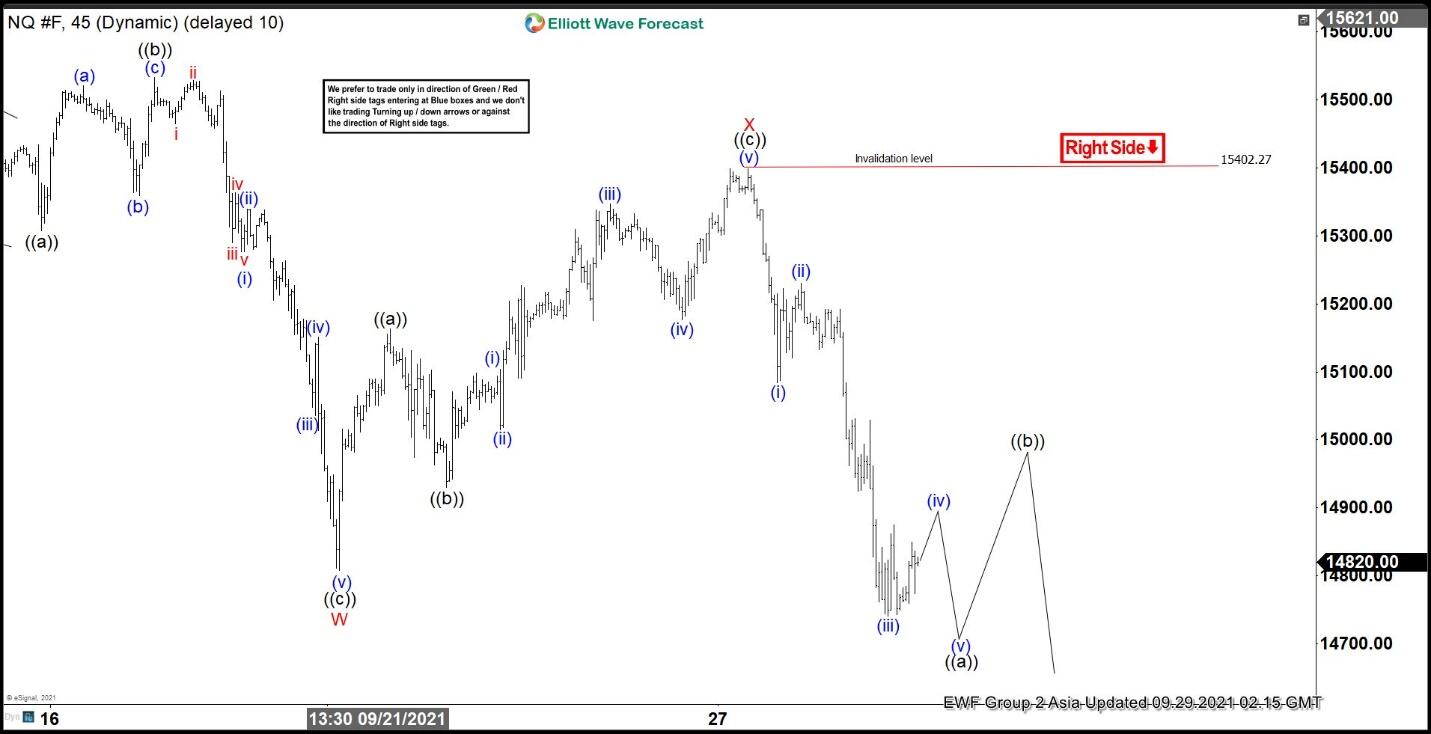
Short Term view in Nasdaq (NQ_F) suggests the decline from Sept 6, 2021 peak is unfolding as a double three Elliott Wave structure. Down from Sept 6 peak, wave W ended at 14807.5 as a zigzag structure. Wave ((a)) of W ended at 15307.75 and rally in wave ((b)) of W ended at 15532.50. The third leg wave ((c)) of W lower ended at 14807.50. Rally in wave X has also ended at 15402.27 as a zigzag structure. Up from wave W, wave ((a)) ended at 15163.25, pullback in wave ((b)) ended at 14930.50, and wave ((c)) of X ended at 15402.27.

Index has turned lower within wave Y with internal subdivision as a zigzag structure. Down from wave X, wave (i) ended at 15084 and bounce in wave (ii) ended at 15230.75. Wave (iii) lower ended at 14740.75. Expect a rally in wave (iv) to follow and then another turn lower to finish wave (v) as well as wave ((a)). Afterwards, it should rally in wave ((b)) to correct cycle from September 27 peak before the decline resumes again. Near term, as far as pivot at 15402 high remains intact, expect rally to fail in 3, 7, or 11 swing for more downside.

NQ_F 45 Minutes Elliott Wave Chart


Nasdaq Elliott Wave Video

Author

Elliott Wave Forecast Team

Elliott Wave Forecast Team

ElliottWave-Forecast.com

More from Elliott Wave Forecast Team
Share:

Markets move fast. We move first.

Orange Juice Newsletter brings you expert driven insights - not headlines. Every day on your inbox.

By subscribing you agree to our Terms and conditions.

Editor's Picks

EUR/USD could test 1.1750 amid strengthening bullish bias

EUR/USD remains flat after two days of small losses, trading around 1.1740 during the Asian hours on Thursday. On the daily chart, technical analysis indicates a strengthening of a bullish bias, as the pair continues to trade within an ascending channel pattern.

GBP/USD consolidates above mid-1.3300s as traders await BoE and US CPI report

The GBP/USD pair struggles to capitalize on the overnight bounce from the 1.3310 area, or a one-week low, and oscillates in a narrow band during the Asian session on Thursday. Spot prices currently trade around the 1.3370 region, down less than 0.10% for the day, as traders opt to wait on the sidelines ahead of the key central bank event risk and US consumer inflation data.

Gold awaits weekly trading range breakout ahead of US CPI report

Gold struggles to capitalize on the previous day's move higher back closer to the $4,350 level and trades with a mild negative bias during the Asian session on Thursday. The downtick could be attributed to some profit-taking amid a US Dollar uptick, though it is likely to remain cushioned on the back of a supportive fundamental backdrop. 

Dogecoin breaks key support amid declining investor confidence

Dogecoin trades in the red on Thursday, following a 4% decline on the previous day. The DOGE supply in profit declines as large wallet investors trim their portfolios. Derivatives data shows a surge in bearish positions amid declining retail interest.

Monetary policy: Three central banks, three decisions, the same caution

While the Fed eased its monetary policy on 10 December for the third consecutive FOMC meeting, without making any guarantees about future action, the BoE, the ECB and the BoJ are holding their respective meetings this week. 

Dogecoin Price Forecast: DOGE breaks key support amid declining investor confidence

Dogecoin (DOGE) trades in the red on Thursday, following a 4% decline on the previous day. The DOGE supply in profit declines as large wallet investors trim their portfolios. Derivatives data shows a surge in bearish positions amid declining retail interest.