Elliott Wave View: Further Rally in Amazon (AMZN) [Video]
![Elliott Wave View: Further Rally in Amazon (AMZN) [Video]](https://editorial.fxstreet.com/images/Markets/Equities/Exchange_iStock_000002664244_Medium_XtraLarge.jpg)
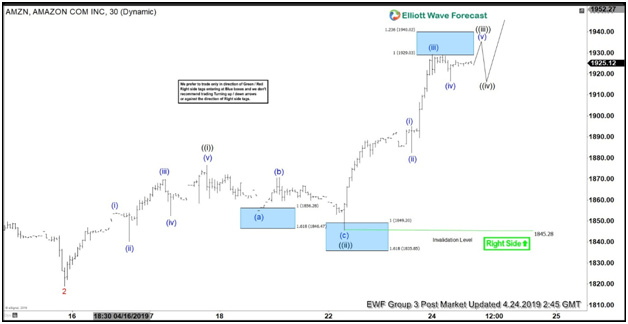
Since bottoming on December 24, 2018 low, Amazon (ticker: AMZN) has continued to recover. The sequence from December 2018 low remains incomplete with 100% extension coming at $2033 – $2143. In shorter cycle, we can see from the chart below that the pullback to $1818.90 ended wave 2. Wave 3 is in progress and subdivides as an impulse Elliott Wave structure. Up from $1818.90, rally to $1876.47 ended wave ((i)) with subdivision also as an impulse of lesser degree. Wave (i) of ((i)) ended at $1853.67, and wave (ii) of ((i)) ended at $1840.26. Wave (iii) of ((i)) ended at $1869.72, wave (iv) of ((i)) ended at $1852.50, and wave (v) of ((i)) ended at $1876.47.
The stock then pullback in wave ((ii)) and ended at $1845.28. Internal of wave ((ii)) unfolded as a zigzag where wave (a) ended at $1855.01, wave (b) ended at $1870.82, and wave (c) ended at $1845.28. Wave ((iii)) is in progress and Amazon can see 1 more leg higher to end wave ((iii)) before pulling back in wave ((iv)). Similar to wave ((i)), the internal of wave ((iii)) subdivides as an impulse structure in lesser degree. Wave (i) of ((iii)) ended at $1894.95, wave (ii) of ((iii)) ended at $1882.50, wave (iii) of ((iii))) ended at $1929.26, and wave (iv) of ((iii)) ended at $1916.59.
Expect Amazon to see 1 more leg higher to end wave (v) of ((iii)) before pulling back. in wave ((iv)) The stock should continue to find support in 3, 7, or 11 swing as far as wave ((ii)) pivot at 1845.28 remains intact. We don’t like selling the stock.
1 Hour AMZN Elliott Wave Chart Asia Update
1 Hour AMZN Elliott Wave Video
Become a Successful Trader and Master Elliott Wave like a Pro. Start your Free 14 Day Trial at - Elliott Wave Forecast.
Author

Elliott Wave Forecast Team
ElliottWave-Forecast.com


