Dow Futures Elliott Wave view 8.18.2017

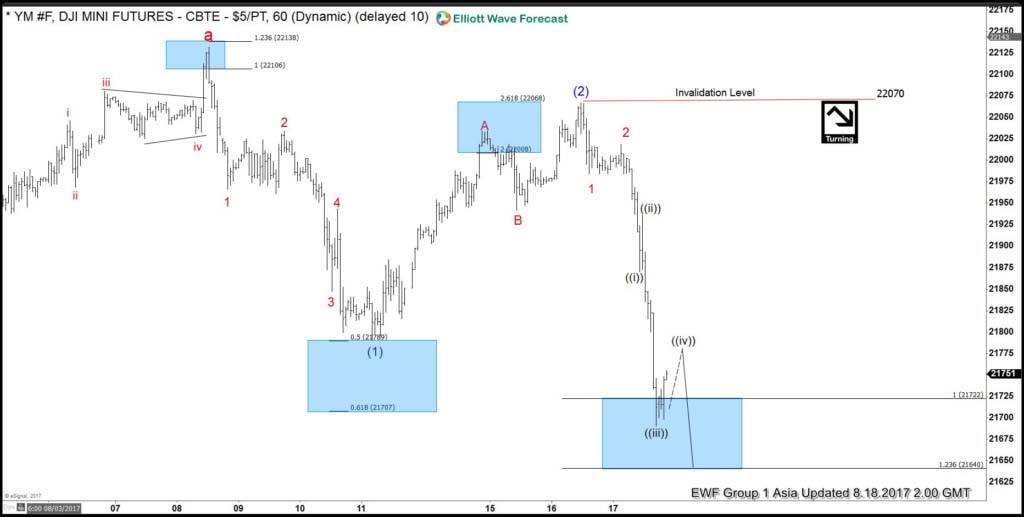
Short term Dow Futures (YM_F) Elliott wave view suggest that the rally to 8/08 peak 22177 ended the “Cycle” from Feb 11, 2016 low. The decline from there is unfolding as animpulse suggesting the index could be following a Elliott Wave Zigzag pattern in larger degree correction. From there Intermediate wave (1) ended at 21789 in 5 waves at 21789 low and bounce from there ended in 3 swings at 22070 peak as another zigzag patternwithin intermediate wave (2).

The decline from there is unfolding as an impulse Elliott wave structure within intermediate wave (3). Below from 21789 peak, Minor wave 1 ended at 21993, Minor wave 2 ended at 22034 peak. Below from there Minute wave ((i)) ended at 21885, Minute wave ((ii)) ended at 21950, Minute wave ((iii)) ended at 21705 low and above from there doing a Minute wave ((iv)) bounce. Which is expected to unfold in 3 swings and shouldn’t pass the 0.382% fibonacci retracement area 21798 of Minute wave ((iii)) for the idea to remain alive for further downside in Minute wave ((v)) of 3 lower initially. We don’t like selling the pullback and expect further downside extension as far as pivot from 22070 peak & more importantly from 22177 peak remains intact to continue correction lower.

Dow Futures 1 Hour Elliott Wave Chart

Chart

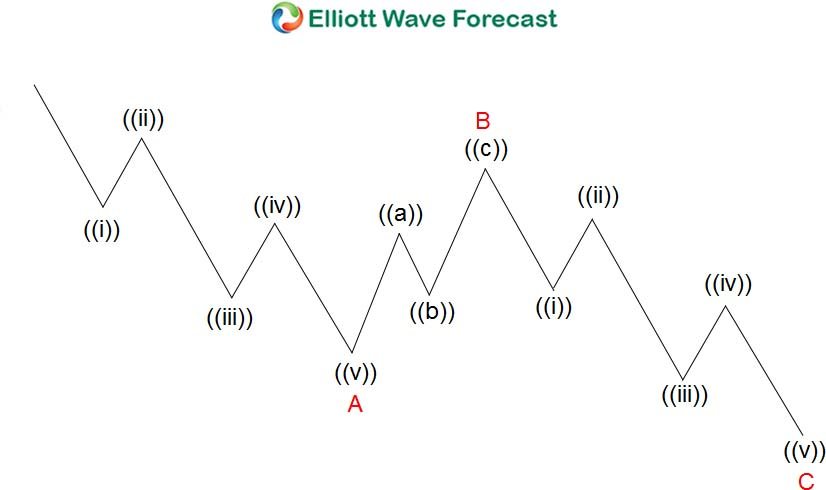
According to Elliott wave theory, the zigzag is a 3-wave structure that has an internal subdivision of (5-3-5) oscillation sequence. The internal oscillations are labeled A, B, C where A = 5 waves, B = 3 waves and C = 5 waves. This means that A and C can be impulsive or diagonal waves. The A and C waves must meet all the conditions of wave structure 5, such as: having an RSI divergence between wave subdivisions, ideal Fibonacci extensions, ideal retracts, etc. In the graph below, we can see how the Zig Zag structure of Elliott Wave looks. 5 waves down in A, 3 waves in B and 5 waves down in C.

Chart

Chart


Become a Successful Trader and Master Elliott Wave like a Pro. Start your Free 14 Day Trial at - Elliott Wave Forecast.

FURTHER DISCLOSURES AND DISCLAIMER CONCERNING RISK, RESPONSIBILITY AND LIABILITY Trading in the Foreign Exchange market is a challenging opportunity where above average returns are available for educated and experienced investors who are willing to take above average risk. However, before deciding to participate in Foreign Exchange (FX) trading, you should carefully consider your investment objectives, level of xperience and risk appetite. Do not invest or trade capital you cannot afford to lose. EME PROCESSING AND CONSULTING, LLC, THEIR REPRESENTATIVES, AND ANYONE WORKING FOR OR WITHIN WWW.ELLIOTTWAVE- FORECAST.COM is not responsible for any loss from any form of distributed advice, signal, analysis, or content. Again, we fully DISCLOSE to the Subscriber base that the Service as a whole, the individual Parties, Representatives, or owners shall not be liable to any and all Subscribers for any losses or damages as a result of any action taken by the Subscriber from any trade idea or signal posted on the website(s) distributed through any form of social-media, email, the website, and/or any other electronic, written, verbal, or future form of communication . All analysis, trading signals, trading recommendations, all charts, communicated interpretations of the wave counts, and all content from any media form produced by www.Elliottwave-forecast.com and/or the Representatives are solely the opinions and best efforts of the respective author(s). In general Forex instruments are highly leveraged, and traders can lose some or all of their initial margin funds. All content provided by www.Elliottwave-forecast.com is expressed in good faith and is intended to help Subscribers succeed in the marketplace, but it is never guaranteed. There is no “holy grail” to trading or forecasting the market and we are wrong sometimes like everyone else. Please understand and accept the risk involved when making any trading and/or investment decision. UNDERSTAND that all the content we provide is protected through copyright of EME PROCESSING AND CONSULTING, LLC. It is illegal to disseminate in any form of communication any part or all of our proprietary information without specific authorization. UNDERSTAND that you also agree to not allow persons that are not PAID SUBSCRIBERS to view any of the content not released publicly. IF YOU ARE FOUND TO BE IN VIOLATION OF THESE RESTRICTIONS you or your firm (as the Subscriber) will be charged fully with no discount for one year subscription to our Premium Plus Plan at $1,799.88 for EACH person or firm who received any of our content illegally through the respected intermediary’s (Subscriber in violation of terms) channel(s) of communication.

Recommended Content


Recommended Content

Editors’ Picks

GBP/USD slides to its lowest level since November, eyes 1.2400 ahead of UK jobs data

GBP/USD slides to its lowest level since November, eyes 1.2400 ahead of UK jobs data

GBP/USD drifts lower for the third straight day on Tuesday and drops to its lowest level since November 17 during the Asian session. Spot prices trade around the 1.2420 region as traders now look to the UK monthly employment details for a fresh impetus.

GBP/USD News

EUR/USD steadies above 1.0600, awaits German ZEW and Powell speech

EUR/USD steadies above 1.0600, awaits German ZEW and Powell speech

EUR/USD is holding above 1.0600 in early Europe Tuesday, having hit fresh five-month lows. The pair draws support from sluggish US Treasury bond yields but the rebound appears capped amid a stronger US Dollar and risk-aversion. Germany's ZEW survey and Powell awaited. 

EUR/USD News

Gold price holds steady below $2,400 mark, bullish potential seems intact

Gold price holds steady below $2,400 mark, bullish potential seems intact

Gold price oscillates in a narrow band on Tuesday and remains close to the all-time peak. The worsening Middle East crisis weighs on investors’ sentiment and benefits the metal. Reduced Fed rate cut bets lift the USD to a fresh YTD top and cap gains for the XAU/USD.

Gold News

SOL primed for a breakout as it completes a rounding bottom pattern

SOL primed for a breakout as it completes a rounding bottom pattern

Solana price has conformed to the broader market crash, following in the steps of Bitcoin price that remains in the red below the $65,000 threshold. For SOL, however, the sensational altcoin could have a big move in store.

Read more

Key economic and earnings releases to watch

Key economic and earnings releases to watch

The market’s focus may be on geopolitical issues at the start of this week, but there is a large amount of economic data and more earnings releases to digest in the coming days. 

Read more

Majors

Cryptocurrencies

Signatures