|

Elliott Wave Analysis of the NYSE Composite Index

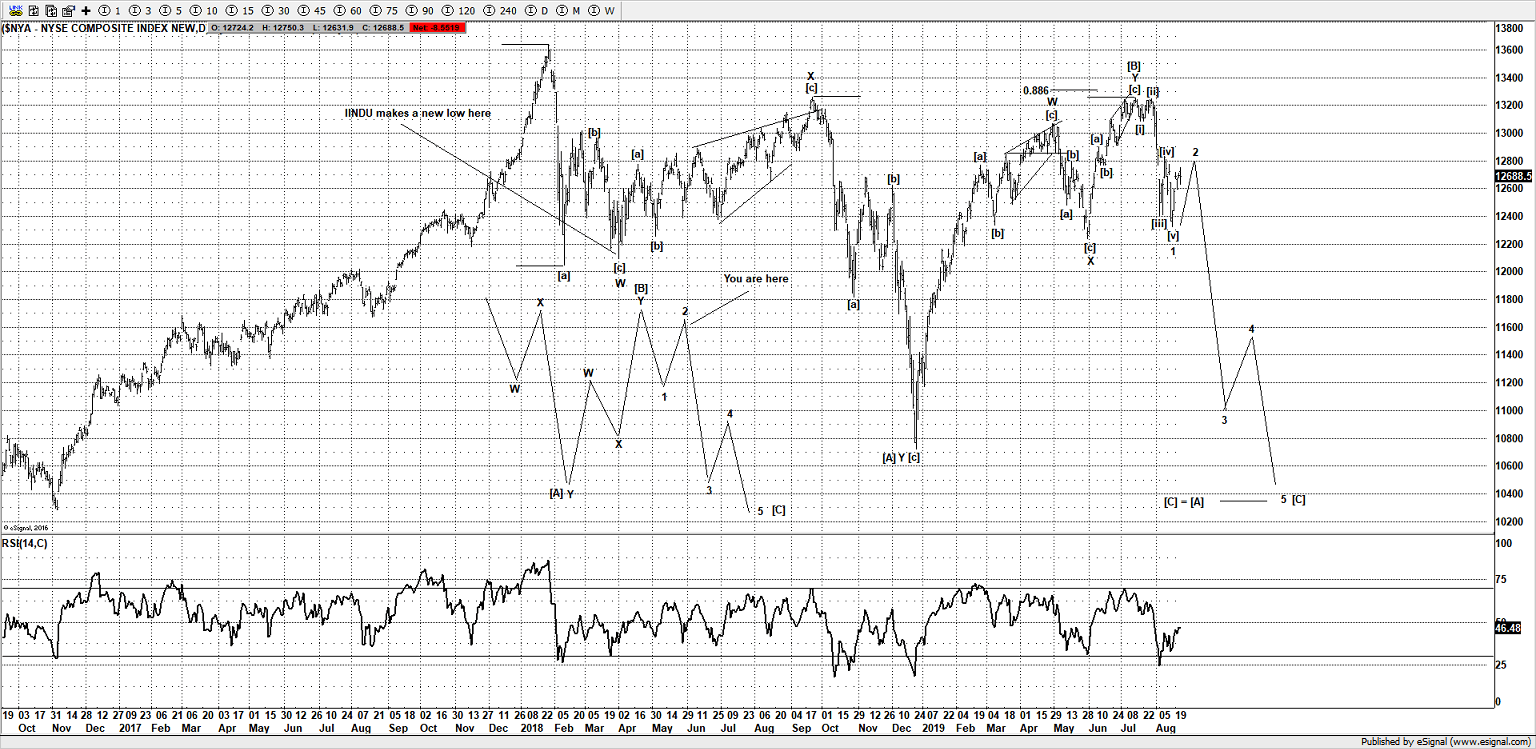
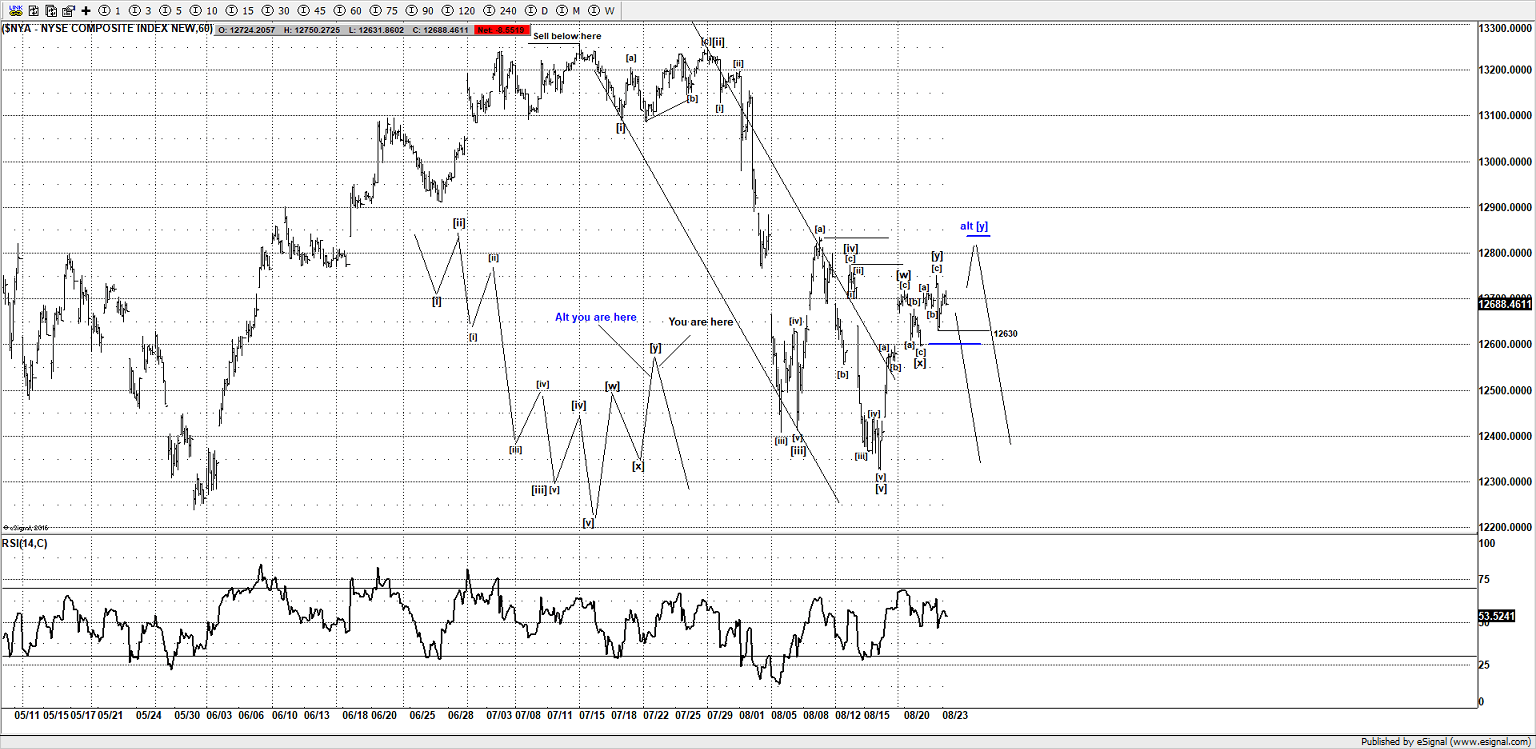
The declines on both the INDU (DJIA) and NYSE can be counted as a 5 wave move from their respective Jul 2019 highs for an impulse wave, both markets have extra gyrations which allow us to be able to count an impulse wave.

Whilst the SPX and NDX declines from their Jul 2019 highs are not as clear as some other US markets, the declines on the INDU and NYSE could be offering substantial clues to suggest the next 'likely' direction for the SPX and NDX. If the current bounces remain as a corrective pattern on both the NYSE and INDU, then it can support a move lower for the broad markets, regardless if the SPX and NDX push a bit higher.

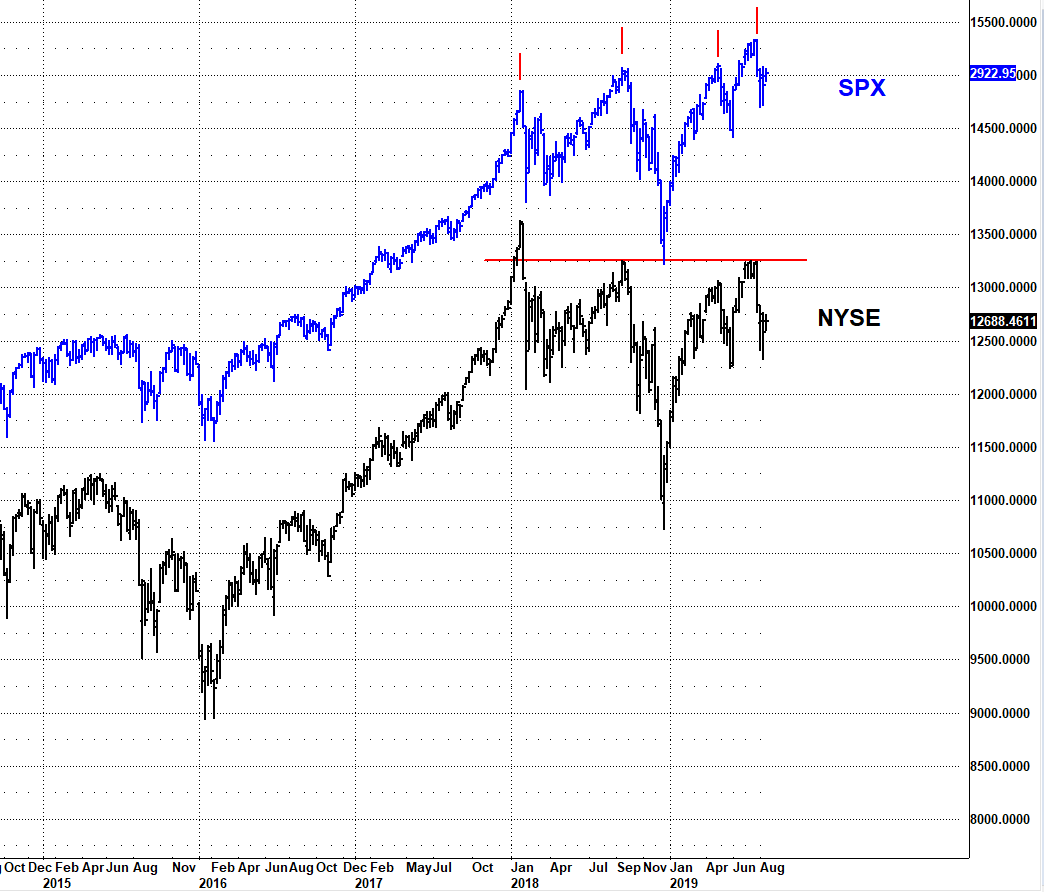
If you have been actively watching the markets over the past 18 months you may have noticed that some US markets have not participated in the new all-time highs made by the SPX and NDX, that's a bearish non-confirmation.

So going forward, a little more upside could be seen in the US markets, but as long as they remain below their respective Jul 2019 highs, then we are going to maintain a bearish bias and look for opportunities to sell the SPX and NDX. The ideas on the INDU and NYSE further support the bearish setups we are currently tracking on the SPX and NDX.

We are wrong if any of the markets move above their respective Jul 2019 highs. So in the case of the INDU, SPX, and NDX, that would mean a new all-time high.

Chart
Chart
Chart

Author

Wave Pattern Traders Team

Wave Pattern Traders Team

Wave Pattern Traders

Specialists in the use of Elliott Wave, Market Analysis, Fractals & Fibonacci.

More from Wave Pattern Traders Team
Share:

Editor's Picks

EUR/USD stays defensive below 1.1900 as USD recovers

EUR/USD trades in negative territory for the third consecutive day, below 1.1900 in the European session on Thursday. A modest rebound in the US Dollar is weighing on the pair, despite an upbeat market mood. Traders keep an eye on the US weekly Initial Jobless Claims data for further trading impetus. 

GBP/USD holds above 1.3600 after UK data dump

\GBP/USD moves little while holding above 1.3600 in the European session on Thursday, following the release of the UK Q4 preliminary GDP, which showed a 0.1% growth against a 0.2% increase expected. The UK industrial sector activity deteriorated in Decembert, keeping the downward pressure intact on the Pound Sterling. 

Gold sticks to modest intraday losses as reduced March Fed rate cut bets underpin USD

Gold languishes near the lower end of its daily range heading into the European session on Thursday. The precious metal, however, lacks follow-through selling amid mixed cues and currently trades above the $5,050 level, well within striking distance of a nearly two-week low touched the previous day.

Cardano eyes short-term rebound as derivatives sentiment improves

Cardano (ADA) is trading at $0.257 at the time of writing on Thursday, after slipping more than 4% so far this week. Derivatives sentiment improves as ADA’s funding rates turn positive alongside rising long bets among traders.

A tale of two labour markets: Headline strength masks underlying weakness

Undoubtedly, yesterday’s delayed US January jobs report delivered a strong headline – one that surpassed most estimates. However, optimism quickly faded amid sobering benchmark revisions.

Sonic Labs’ vertical integration fuels recovery in S token

Sonic, previously Fantom (FTM), is extending its recovery trade at $0.048 at the time of writing, after rebounding by over 12% the previous day. The recovery thesis’ strengths lie in the optimism surrounding Sonic Labs’ Wednesday announcement to shift to a vertically integrated model, aimed at boosting S token utility.