Eco News Proves Too Much for Markets

Good Morning Traders,
As of this writing 4:05 AM EST, here’s what we see:
US Dollar: Mar. USD is Up at 101.140.
Energies: February Crude is Up at 52.38.
Financials: The Mar 30 year bond is Down 14 ticks and trading at 151.19.
Indices: The March S&P 500 emini ES contract is 7 ticks Lower and trading at 2267.75.
Gold: The February gold contract is trading Down at 1202.50. Gold is 96 ticks Lower than its close.
Initial Conclusion
This is not a correlated market. The dollar is Up+ and crude is Up+ which is not normal but the 30 year bond is trading Down-. The Financials should always correlate with the US dollar such that if the dollar is lower then bonds should follow and vice-versa. The indices are Down- and Crude is trading Up+ which is correlated. Gold is trading Down which is correlated with the US dollar trading Up. I tend to believe that Gold has an inverse relationship with the US Dollar as when the US Dollar is down, Gold tends to rise in value and vice-versa. Think of it as a seesaw, when one is up the other should be down. I point this out to you to make you aware that when we don’t have a correlated market, it means something is wrong. As traders you need to be aware of this and proceed with your eyes wide open.
Asia traded mixed with half the exchanges higher and the other half lower. As of this writing all of Europe is trading lower.
Possible Challenges To Traders Today
– Building Permits is out at 8:30 AM. This is major.
– Philly Fed Mfg Index is out at 8:30 AM EST. This is major.
– Unemployment Claims is out at 8:30 AM EST. This is major.
– Housing Starts is out at 8:30 AM EST. This is major.
– Natural Gas Storage is out at 10:30 AM. This is major.
– Crude Oil Inventories is out at 11 AM EST. This is major.
– Fed Chair Yellen Speaks at 8 PM EST. This is major.
Treasuries
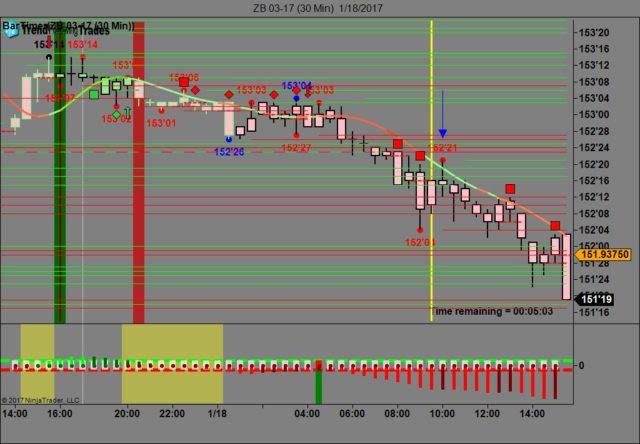
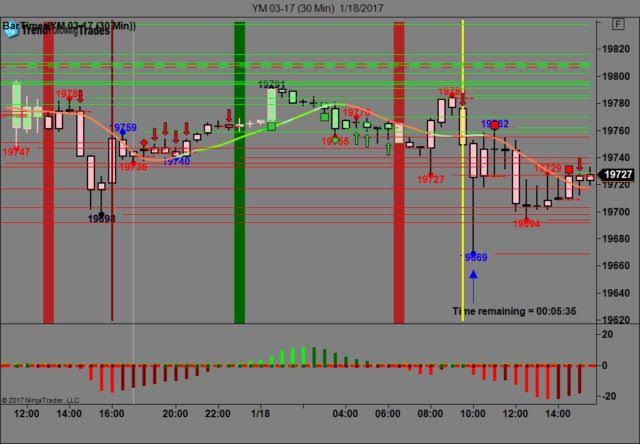
We’ve elected to switch gears a bit and show correlation between the 30 year bond (ZB) and The YM futures contract. The YM contract is the DJIA and the purpose is to show reverse correlation between the two instruments. Remember it’s liken to a seesaw, when up goes up the other should go down and vice versa.
Yesterday the ZB made it’s move at around 10 AM EST at around the time the NAHB Housing Market numbers came out. The ZB hit a high at around that time and the YM hit a low. If you look at the charts below ZB gave a signal at around 10 AM EST and the YM was moving higher at the same time. Look at the charts below and you’ll see a pattern for both assets. ZB hit a high at around 10 AM EST and the YM hit a low. These charts represent the newest version of Trend Following Trades and I’ve changed the timeframe to a 30 minute chart to display better. This represented a shorting opportunity on the 30 year bond, as a trader you could have netted about 30 plus ticks per contract on this trade. Each tick is worth $31.25. We added a Donchian Channel to the charts to show the signals more clearly. Charts Courtesy of Trend Following Trades built on a NinjaTrader platform Click on an image to enlarge it.
Bias
Yesterday we gave the markets an upside bias as both the Bonds and Gold were both trading lower and this usually bodes well for an upside day. The markets (at least for the Dow) had other ideas as the Dow dropped 22 points however the S&P and Nasdaq both gained ground. Today we aren’t dealing with a correlated market and our bias is neutral.
Could this change? Of Course. Remember anything can happen in a volatile market.
Commentary
Well it appears as though we’ve had another news tsunami yesterday as there were 8 economic reports, most of which were major. NAHB Housing numbers came in lower than expected and the CPI came in higher. This is not good from a Fed point of view as they’ll claim their priority is inflation and having a higher CPI will fuel that fodder. Janet Yellen has stated that between now and the end of 2019, they’ll be a few more rate hikes per year. If we to assume 3 rate hikes per year plus where the rate is now (0.75%) we’re looking at an Overnight Rate of 3.0%. This assumes that each rate hike will be incremented by 25 basis points. Today it appears as though we’ll have another news tsunami to deal with as today we have 7 economic reports, all of which are major….
Author

Nick Mastrandrea
Market Tea Leaves


