In this blog-post, I want to discuss with you guys, why we think that the Dow Jones Transportation Average can still see more upside.

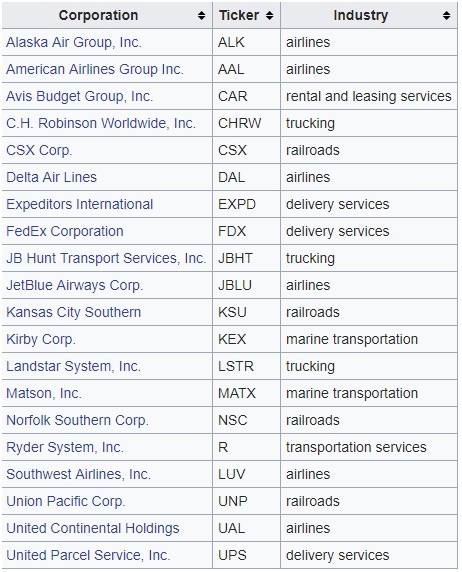
First of all, let me explain what the Dow Jones Transportation Average Index is. The DJT is made off of the top 20 delivery, airline, trucking and railroad stocks. In the chart below you can see the companies listed in that index. The DJT is the oldest stock index which was created by Charles Dow in 1884.

Dow Jones Transportation Index Companies

DowJones

But why do we need to take this specific index into consideration? Well, The Dow Jones Transportation Average is closely monitored by economists to gauge the state of the U.S economy, especially by people who follow the Dow Theory. The Dow Transportation Index is often a leading indicator of where the Dow Jones Index is overall heading because people and businesses ship and sends more stuff when the economy, (especially the business economy) is doing well, and they pull back when it isn’t. Obviously, we need to understand that it’s not a perfect gauge but it surely can give us an approximate path. Anyway, if you have an overall look at the index you can make out that it’s a kind of leading indicator to the U.S. indices. Especially with the Dow Jones Industrial Average in comparison.

Dow Jones Transportation Index vs Dow Jones Industrial Average Weekly Charts

Elliot

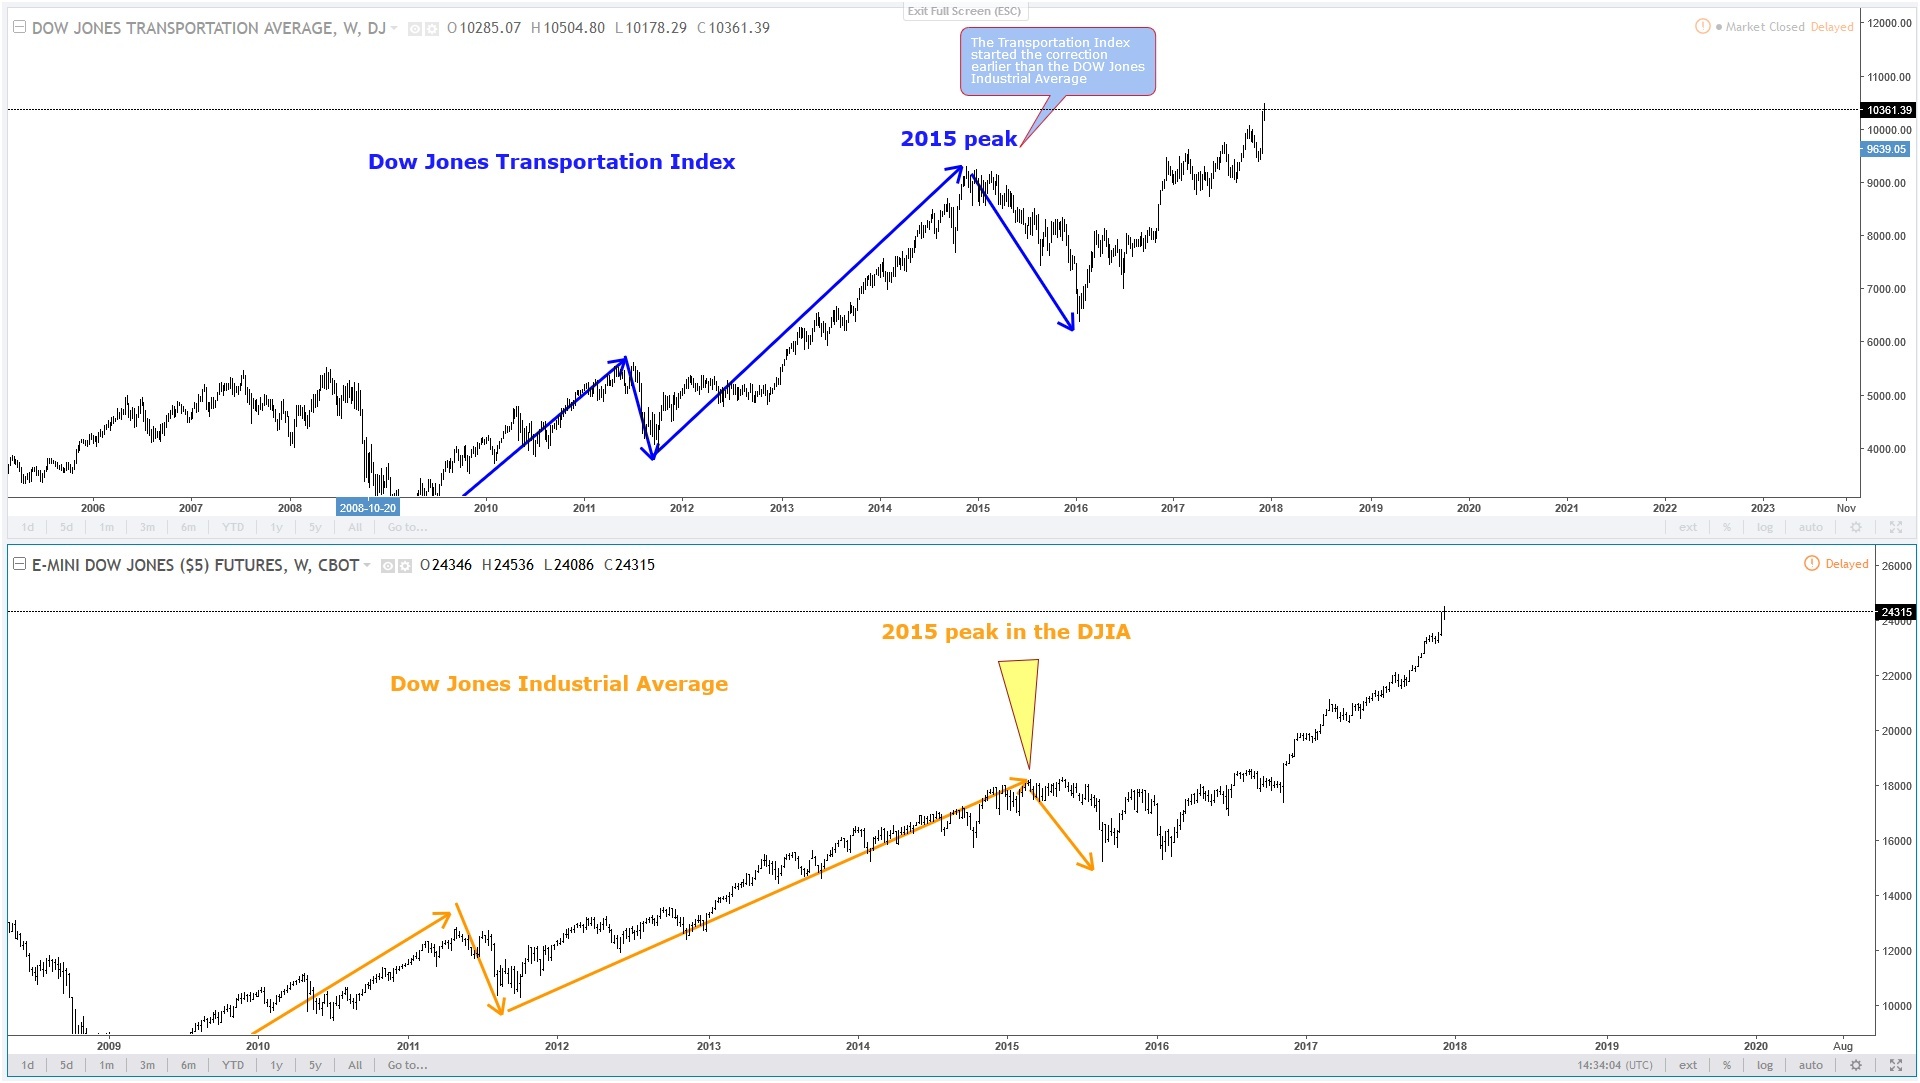
You can see in the chart above that the DJT (First chart) topped in 2015 first, whereas the Dow Jones industrial average was still rallying to the upside before turning lower as well. This is only one of many examples you can find when comparing them together.

Now, let’s have a more detailed look at the DJT.

Dow Jones Transportation Index Monthly Chart

DowJones

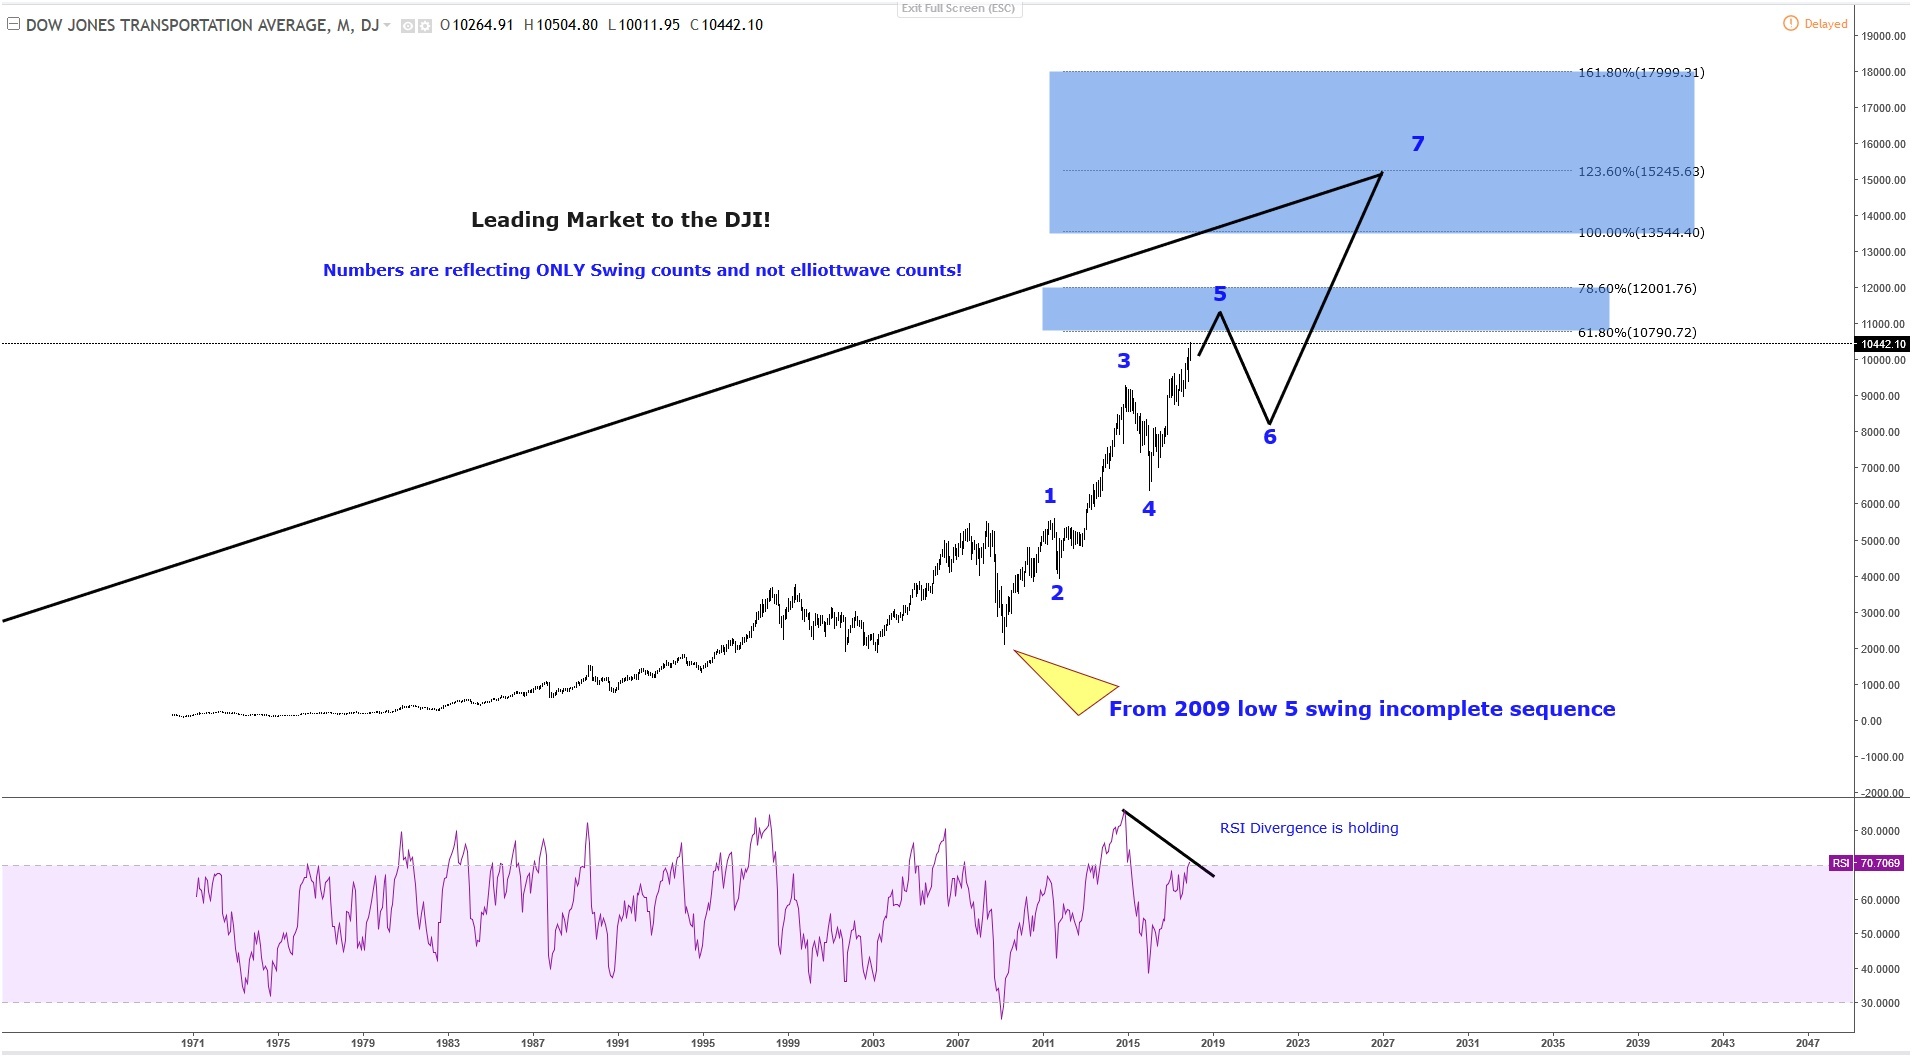
First of all, you need to understand that today’s market can advance in 2 types of sequences. The first type is 5-9-13 or motive sequence and the second type is the 3-7-11  corrective sequence. The Dow Jones Transportation Index is in a corrective sequence, where the market is currently in the 5th swing which needs to come with RSI divergence. That confirms that the market is from 2009 unfolding a 5 swing incomplete sequence and consequently it has not reached the 100% from 2009 low. However, soon a correction in the 6 swing should occur. But in the long term view, we still remain bullish. This chart can just be another confirmation that indices could still make another push higher.


Become a Successful Trader and Master Elliott Wave like a Pro. Start your Free 14 Day Trial at - Elliott Wave Forecast.

FURTHER DISCLOSURES AND DISCLAIMER CONCERNING RISK, RESPONSIBILITY AND LIABILITY Trading in the Foreign Exchange market is a challenging opportunity where above average returns are available for educated and experienced investors who are willing to take above average risk. However, before deciding to participate in Foreign Exchange (FX) trading, you should carefully consider your investment objectives, level of xperience and risk appetite. Do not invest or trade capital you cannot afford to lose. EME PROCESSING AND CONSULTING, LLC, THEIR REPRESENTATIVES, AND ANYONE WORKING FOR OR WITHIN WWW.ELLIOTTWAVE- FORECAST.COM is not responsible for any loss from any form of distributed advice, signal, analysis, or content. Again, we fully DISCLOSE to the Subscriber base that the Service as a whole, the individual Parties, Representatives, or owners shall not be liable to any and all Subscribers for any losses or damages as a result of any action taken by the Subscriber from any trade idea or signal posted on the website(s) distributed through any form of social-media, email, the website, and/or any other electronic, written, verbal, or future form of communication . All analysis, trading signals, trading recommendations, all charts, communicated interpretations of the wave counts, and all content from any media form produced by www.Elliottwave-forecast.com and/or the Representatives are solely the opinions and best efforts of the respective author(s). In general Forex instruments are highly leveraged, and traders can lose some or all of their initial margin funds. All content provided by www.Elliottwave-forecast.com is expressed in good faith and is intended to help Subscribers succeed in the marketplace, but it is never guaranteed. There is no “holy grail” to trading or forecasting the market and we are wrong sometimes like everyone else. Please understand and accept the risk involved when making any trading and/or investment decision. UNDERSTAND that all the content we provide is protected through copyright of EME PROCESSING AND CONSULTING, LLC. It is illegal to disseminate in any form of communication any part or all of our proprietary information without specific authorization. UNDERSTAND that you also agree to not allow persons that are not PAID SUBSCRIBERS to view any of the content not released publicly. IF YOU ARE FOUND TO BE IN VIOLATION OF THESE RESTRICTIONS you or your firm (as the Subscriber) will be charged fully with no discount for one year subscription to our Premium Plus Plan at $1,799.88 for EACH person or firm who received any of our content illegally through the respected intermediary’s (Subscriber in violation of terms) channel(s) of communication.

Recommended Content


Recommended Content

Editors’ Picks

EUR/USD holds gains near 1.0650 amid risk reset

EUR/USD holds gains near 1.0650 amid risk reset

EUR/USD is holding onto its recovery mode near 1.0650 in European trading on Friday. A recovery in risk sentiment is helping the pair, as the safe-haven US Dollar pares gains. Earlier today, reports of an Israeli strike inside Iran spooked markets. 

EUR/USD News

GBP/USD recovers toward 1.2450 after UK Retail Sales data

GBP/USD recovers toward 1.2450 after UK Retail Sales data

GBP/USD is rebounding toward 1.2450 in early Europe on Friday, having tested 1.2400 after the UK Retail Sales volumes stagnated again in March, The pair recovers in tandem with risk sentiment, as traders take account of the likely Israel's missile strikes on Iran. 

GBP/USD News

Gold price defends gains below $2,400 as geopolitical risks linger

Gold price defends gains below $2,400 as geopolitical risks linger

Gold price is trading below $2,400 in European trading on Friday, holding its retreat from a fresh five-day high of $2,418. Despite the pullback, Gold price remains on track to book the fifth weekly gain in a row, supported by lingering Middle East geopolitical risks.

Gold News

Bitcoin Weekly Forecast: BTC post-halving rally could be partially priced in Premium

Bitcoin Weekly Forecast: BTC post-halving rally could be partially priced in

Bitcoin price shows no signs of directional bias while it holds above  $60,000. The fourth BTC halving is partially priced in, according to Deutsche Bank’s research. 

Read more

Geopolitics once again take centre stage, as UK Retail Sales wither

Geopolitics once again take centre stage, as UK Retail Sales wither

Nearly a week to the day when Iran sent drones and missiles into Israel, Israel has retaliated and sent a missile into Iran. The initial reports caused a large uptick in the oil price.

Read more

Majors

Cryptocurrencies

Signatures