|

Dow Jones – Short-Term Corrective Above Major S/R Zone & Previous ATH (Weekly chart)

Price Action Context

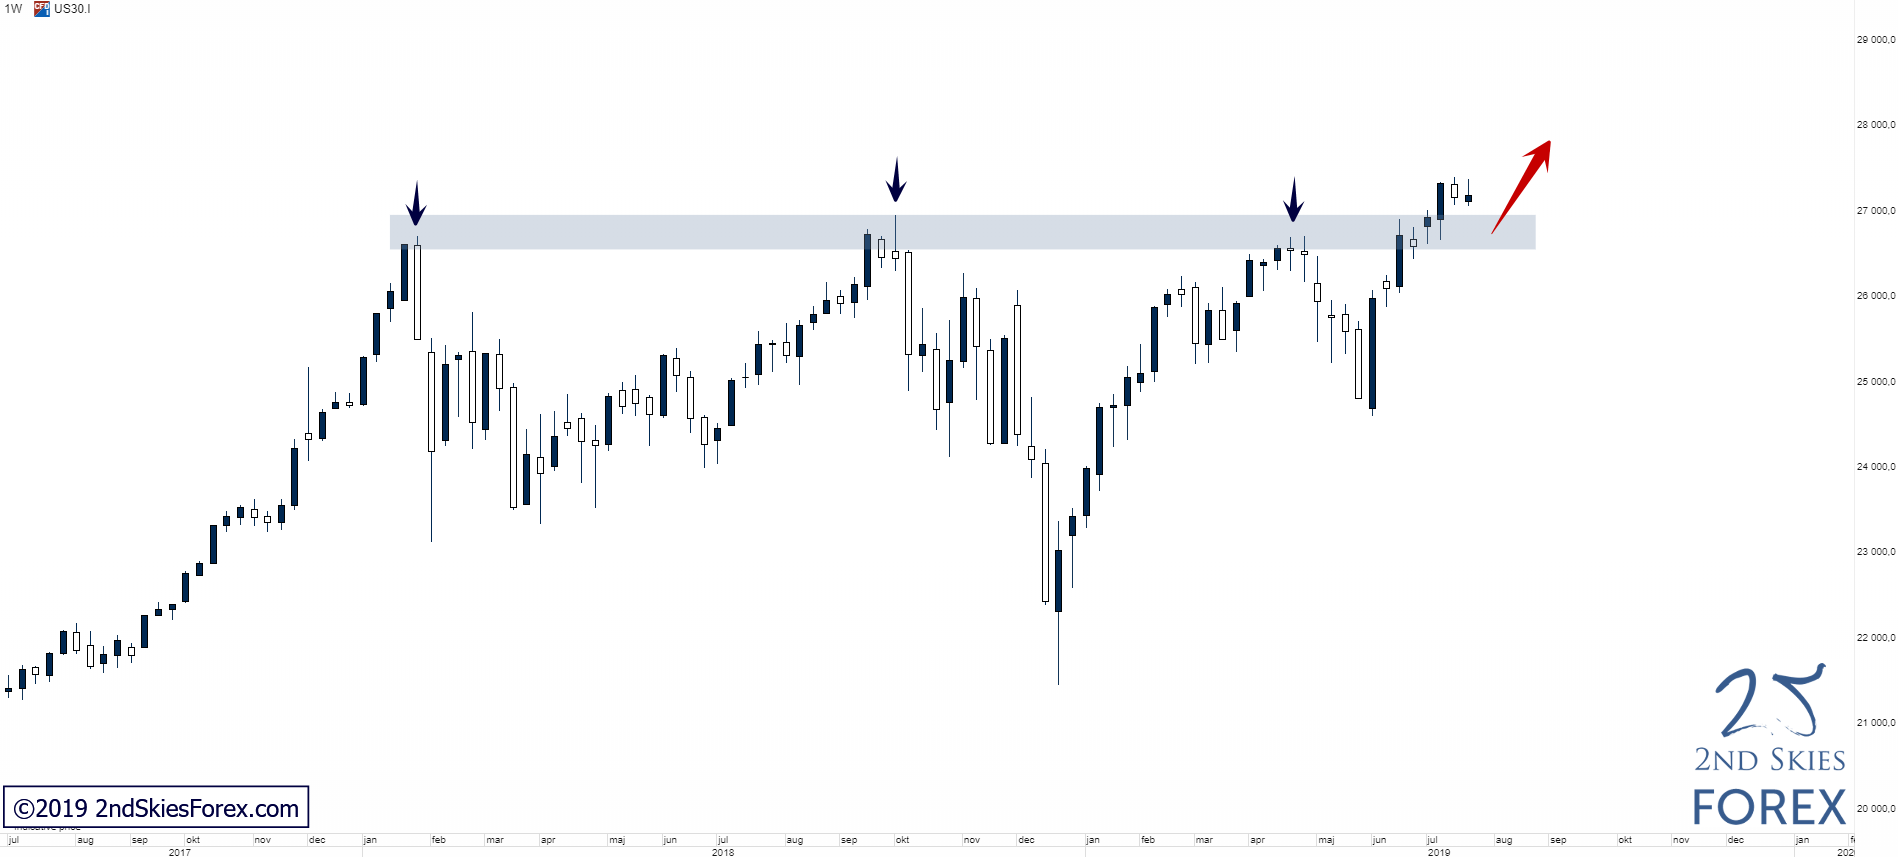
The very clean key resistance that had held since Jan 2018 was broken to the upside this month and currently the industrial index is trading within a short-term corrective structure above the long-term S/R zone which now should act as support on weak pullbacks.

Trending Analysis

Long-term bias is bullish, and bulls can look for potential trading opportunities on weak pullbacks into the long-term support.

Key Support & Resistance Zones

R: n/a
S: 26 550 – 26 950


Visit our website at 2ndSkies for more price action content, free trading lessons, strategies and videos. Find out how we can help you to change the way you think, trade and perform.

Author

Chris Capre

Chris Capre

2ndskiesforex

Chris Capre is a professional forex trader and mentor specialized in Price Action trading, and the Ichimoku Cloud.

More from Chris Capre
Share:

Editor's Picks

EUR/USD trims gains, hovers around 1.1900 post-US data

EUR/USD trades slightly on the back foot around the 1.1900 region in a context dominated by the resurgence of some buying interest around the US Dollar on turnaround Tuesday. Looking at the US docket, Retail Sales disappointed expectations in December, while the ADP 4-Week Average came in at 6.5K.

GBP/USD comes under pressure near 1.3680

The better tone in the Greenback hurts the risk-linked complex on Tuesday, prompting GBP/USD to set aside two consecutive days of gains and trade slightly on the defensive below the 1.3700 mark. Investors, in the meantime, keep their attention on key UK data due later in the week.

Gold loses some traction, still above $5,000

Gold faces some selling pressure on Tuesday, surrendering part of its recent two-day advance although managing to keep the trade above the $5,000 mark per troy ounce. The daily pullback in the precious metal comes in response to the modest rebound in the US Dollar, while declining US Treasury yields across the curve seem to limit the downside.

Bitcoin Cash trades lower, risks dead-cat bounce amid bearish signals

Bitcoin Cash trades in the red below $522 at the time of writing on Tuesday, after multiple rejections at key resistance. BCH’s derivatives and on-chain indicators point to growing bearish sentiment and raise the risk of a dead-cat bounce toward lower support levels.

Dollar drops and stocks rally:  The week of reckoning for US economic data

Following a sizeable move lower in US technology Stocks last week, we have witnessed a meaningful recovery unfold. The USD Index is in a concerning position; the monthly price continues to hold the south channel support.

Bitcoin Cash trades lower, risks dead-cat bounce amid bearish signals

Bitcoin Cash (BCH) trades in the red below $522 at the time of writing on Tuesday, after multiple rejections at key resistance. BCH’s derivatives and on-chain indicators point to growing bearish sentiment and raise the risk of a dead-cat bounce toward lower support levels.