|

Dow Jones breaks above a downside resistance line

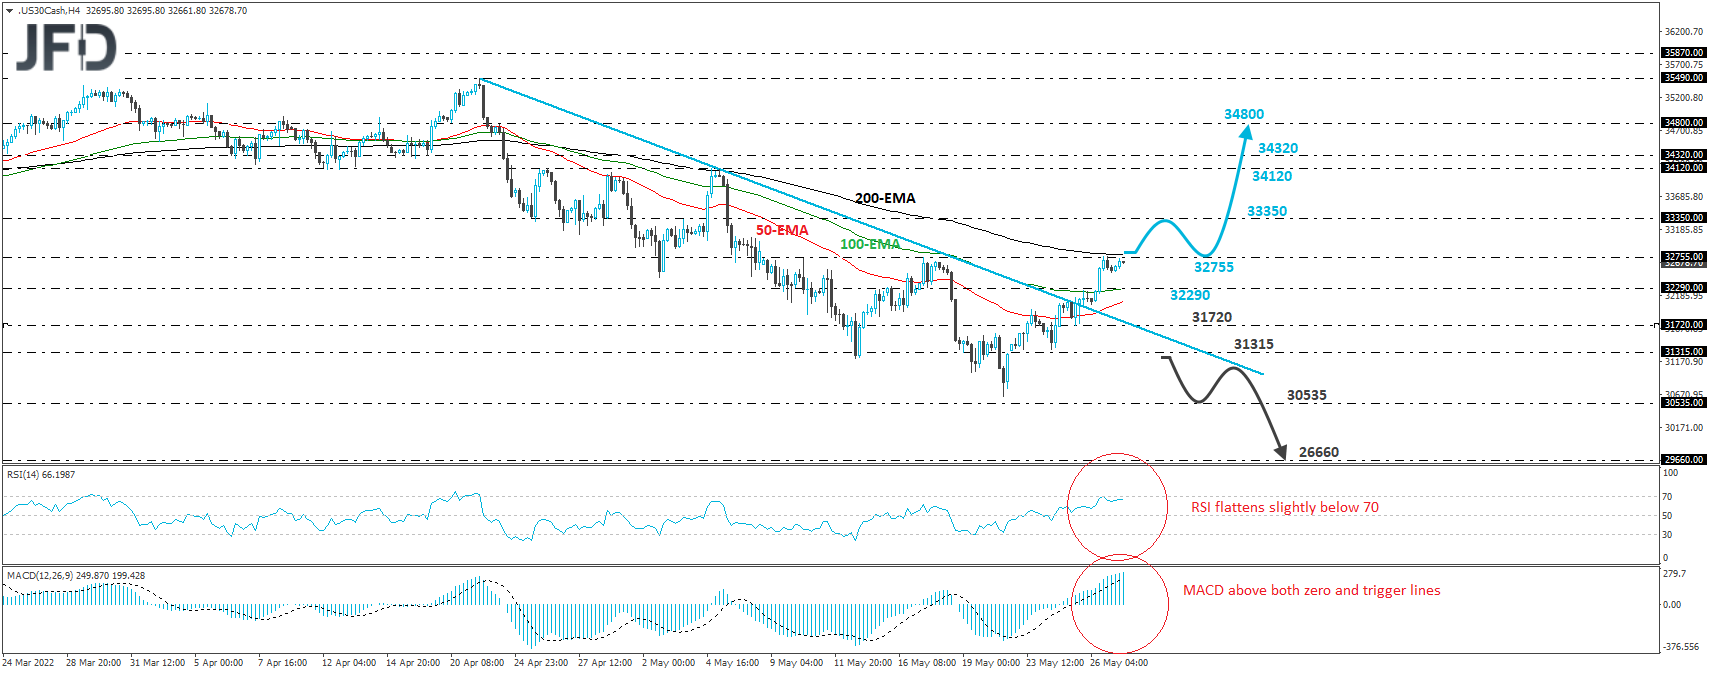
The Dow Jones Industrial Average cash index traded higher on Wednesday, breaking above the downside resistance line drawn from the high of April 21st. The index continued its recovery today as well, reaching the 32755 resistance zone, marked by the high of May 10th. Bearing in mind that the index broke the aforementioned downside line, we would see decent chances for some more advances.

A clear and decisive break above the 32755 zone could encourage the bulls to climb to the 33350 zone, marked by the high of May 3rd, and if they are not willing to stop there, then we may see them pushing towards the 34120 zone, which acted as a key resistance between April 25th and May 5th, or the 34320 barrier, defined by the inside swing low of April 19th. Should neither of those two zones hold, then we could see a test at 34800, the high of April 22nd.

Shifting attention to our short-term oscillators, we see that the RSI flattened near its 70 line, but the MACD remains above both its zero and trigger lines. Both indicators detect strong upside speed, which supports the idea of further advances, but the fact that the RSI has flattened near its 70 line make us careful over a possible setback before the next leg north.

On the downside, we would like to see a clear break below 31315 before we start examining the bearish case again. This could confirm the index’s return back below the downside resistance line taken from the high of April 21st, and could pave the way towards the 30535 zone, which is slightly below the low of May 20th, and is marked by the low of March 4th.

Dow Jones

Author

More from JFD Team
Share:

Editor's Picks

EUR/USD consolidates around 1.0900, bullish bias remains ahead of key US data

The EUR/USD pair is seen consolidating its strong gains registered over the past two days and oscillating in a narrow band during the Asian session on Tuesday. Spot prices currently trade around the 1.1900 mark, just below an over one-week high touched the previous day.

GBP/USD tilts bullish as markets barrel toward mid-week NFP print

GBP/USD is holding a broader bullish structure on the daily chart, with price trading well above the 50 Exponential Moving Average at 1.3507 and the 200 EMA at 1.3310, confirming the intermediate uptrend that has been in place since the November 2025 low near 1.2300. 

Gold: Will US Retail Sales data propel it above $5,100?

Gold hovers below weekly highs of $5,087 early Tuesday, await US Retail Sales data. The US Dollar enters a downside consolidation phase amid persistent Japanese Yen strength and worsening labor market. Gold settled Monday above $5,000, now looks to take out $5,100 amid bullish daily RSI.

Top Crypto Gainers: World Liberty Financial, MemeCore and Quant gain momentum

World Liberty Financial, MemeCore, and Quant are leading gains over the last 24 hours as the broader cryptocurrency market stabilizes after last week’s correction. Still, the technical outlook for altcoins remains mixed due to prevailing downside pressure and vulnerable market sentiment. 

The market is buying everything again but is it dancing on a borrowed floor

The market has a short memory and a fast trigger finger. Last week’s liquidation barely cooled before risk came roaring back, pushing the S&P toward record territory and reinstalling Big Tech as the engine of choice. This is not discovery. It is re exposure.

Ripple exposed to volatility amid low retail interest, modest fund inflows

Ripple (XRP) is extending its intraday decline to around $1.40 at the time of writing on Monday amid growing pressure from the retail market and risk-off sentiment that continues to keep investors on the sidelines.