US Dollar: Jun '22 USD is Down at 102.140.

Energies: Jul '22 Crude is Up at 111.63.

Financials: The Jun '22 30 Year bond is Down 22 ticks and trading at 141.03.

Indices: The Jun '22 S&P 500 Emini ES contract is 96 ticks Higher and trading at 3923.50.

Gold: The Jun'22 Gold contract is trading Up at 1863.00. Gold is 209 ticks Higher than its close.

Initial conclusion

This is a nearly correlated market. The dollar is Down, and Crude is Up which is normal, and the 30-year Bond is trading Lower. The Financials should always correlate with the US dollar such that if the dollar is lower, then the bonds should follow and vice-versa. The S&P is Higher, and Crude is trading Higher which is not correlated. Gold is trading Higher which is correlated with the US dollar trading Down. I tend to believe that Gold has an inverse relationship with the US Dollar as when the US Dollar is down, Gold tends to rise in value and vice-versa. Think of it as a seesaw, when one is up the other should be down. I point this out to you to make you aware that when we don't have a correlated market, it means something is wrong. As traders you need to be aware of this and proceed with your eyes wide open. Asia is trading Mixed with half the exchanges Higher and the other half Lower. Currently all of Europe is trading Mixed as well. .

Possible challenges to traders today

  • No Major economic news to speak of.

  • Lack of Major economic news.

Treasuries

Traders, please note that we've changed the Bond instrument from the 30 year (ZB) to the 10 year (ZN). They work exactly the same.

We've elected to switch gears a bit and show correlation between the 10-year bond (ZN) and the S&P futures contract. The S&P contract is the Standard and Poor's, and the purpose is to show reverse correlation between the two instruments. Remember it's likened to a seesaw, when up goes up the other should go down and vice versa.

On Friday the ZN made its move at around 1:30 PM EST. The ZN hit a High at around that time and the S&P moved Higher shortly thereafter. If you look at the charts below ZN gave a signal at around 1:30 PM EST and the S&P moved Higher at around the same time. Look at the charts below and you'll see a pattern for both assets. ZN hit a High at around 1 PM EST and the S&P was moving Higher shortly thereafter. These charts represent the newest version of MultiCharts and I've changed the timeframe to a 15-minute chart to display better. This represented a Shorting opportunity on the 10-year note, as a trader you could have netted about a dozen ticks per contract on this trade. Each tick is worth $15.625. Please note: the front month for the ZN is now Jun '22. The S&P contract is also Jun' 22 as well. I've changed the format to Heikin-Ashi such that it may be more apparent and visible.

Charts courtesy of MultiCharts built on an AMP platform

TYAM

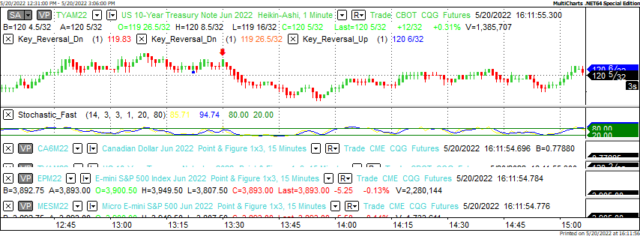
ZN - Jun 2022 - 05/20/22

EPM

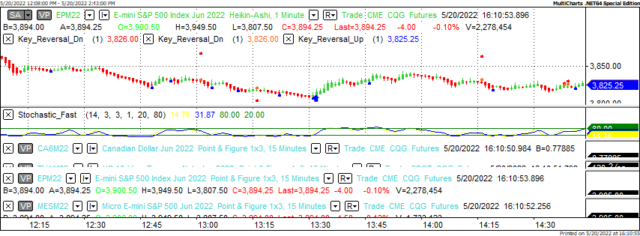
S&P - Jun 2022 - 05/20/22

Bias

On Friday we gave the markets an Upside bias as both the bonds and crude were trading Higher. The Dow closed about 9 points Higher and the S&P closed Higher by 1. The Nasdaq closed in negative territory. Today our bias is to the Upside.

Could this change? Of Course. Remember anything can happen in a volatile market.

Commentary

On Friday we had no economic news to drive the markets in one direction or another and today we have the same situation. The markets initially traded to the Upside as suggested however as the session wore on it dived into negative territory and remained there till the near end of the session where it did close in positive territory by about 9 points. The markets as of late have been challenging in terms of market direction but following rules and guidelines do help to put you on the right side of the market. Today we have no economic news to speak of and the markets will rely on its own devices.


Trading performance displayed herein is hypothetical. The following Commodity Futures Trading Commission (CFTC) disclaimer should be noted.

Hypothetical performance results have many inherent limitations, some of which are described below. No representation is being made that any account will or is likely to achieve profits or losses similar to those shown.

In fact, there are frequently sharp differences between hypothetical performance results and the actual results subsequently achieved by any particular trading program. One of the limitations of hypothetical performance trading results is that they are generally prepared with the benefit of hindsight.

In addition, hypothetical trading does not involve financial risk, and no hypothetical trading record can completely account for the impact of financial risk in actual trading. For example, the ability to withstand losses or to adhere to a particular trading program in spite of trading losses are material points which can also adversely affect actual trading results.

There are numerous other factors related to the markets in general or to the implementation of any specific trading program which cannot be fully accounted for in the preparation of hypothetical performance results and all of which can adversely affect actual trading results.

Trading in the commodities markets involves substantial risk and YOU CAN LOSE A LOT OF MONEY, and thus is not appropriate for everyone. You should carefully consider your financial condition before trading in these markets, and only risk capital should be used.

In addition, these markets are often liquid, making it difficult to execute orders at desired prices. Also, during periods of extreme volatility, trading in these markets may be halted due to so-called “circuit breakers” put in place by the CME to alleviate such volatility. In the event of a trading halt, it may be difficult or impossible to exit a losing position.

Recommended Content


Recommended Content

Editors’ Picks

USD/JPY holds near 155.50 after Tokyo CPI inflation eases more than expected

USD/JPY holds near 155.50 after Tokyo CPI inflation eases more than expected

USD/JPY is trading tightly just below the 156.00 handle, hugging multi-year highs as the Yen continues to deflate. The pair is trading into 30-plus year highs, and bullish momentum is targeting all-time record bids beyond 160.00, a price level the pair hasn’t reached since 1990.

USD/JPY News

AUD/USD stands firm above 0.6500 with markets bracing for Aussie PPI, US inflation

AUD/USD stands firm above 0.6500 with markets bracing for Aussie PPI, US inflation

The Aussie Dollar begins Friday’s Asian session on the right foot against the Greenback after posting gains of 0.33% on Thursday. The AUD/USD advance was sponsored by a United States report showing the economy is growing below estimates while inflation picked up.

AUD/USD News

Gold soars as US economic woes and inflation fears grip investors

Gold soars as US economic woes and inflation fears grip investors

Gold prices advanced modestly during Thursday’s North American session, gaining more than 0.5% following the release of crucial economic data from the United States. GDP figures for the first quarter of 2024 missed estimates, increasing speculation that the US Fed could lower borrowing costs.

Gold News

FBI cautions against non-KYC Bitcoin and crypto money transmitting services as SEC goes after MetaMask

FBI cautions against non-KYC Bitcoin and crypto money transmitting services as SEC goes after MetaMask

US FBI has issued a caution to Bitcoiners and cryptocurrency market enthusiasts, coming on the same day as when the US Securities and Exchange Commission is on the receiving end of a lawsuit, with a new player adding to the list of parties calling for the regulator to restrain its hand.

Read more

Bank of Japan expected to keep interest rates on hold after landmark hike

Bank of Japan expected to keep interest rates on hold after landmark hike

The Bank of Japan is set to leave its short-term rate target unchanged in the range between 0% and 0.1% on Friday, following the conclusion of its two-day monetary policy review meeting for April. The BoJ will announce its decision on Friday at around 3:00 GMT.

Read more

Majors

Cryptocurrencies

Signatures