Don't be fair-weather, be all-weather

S2N spotlight
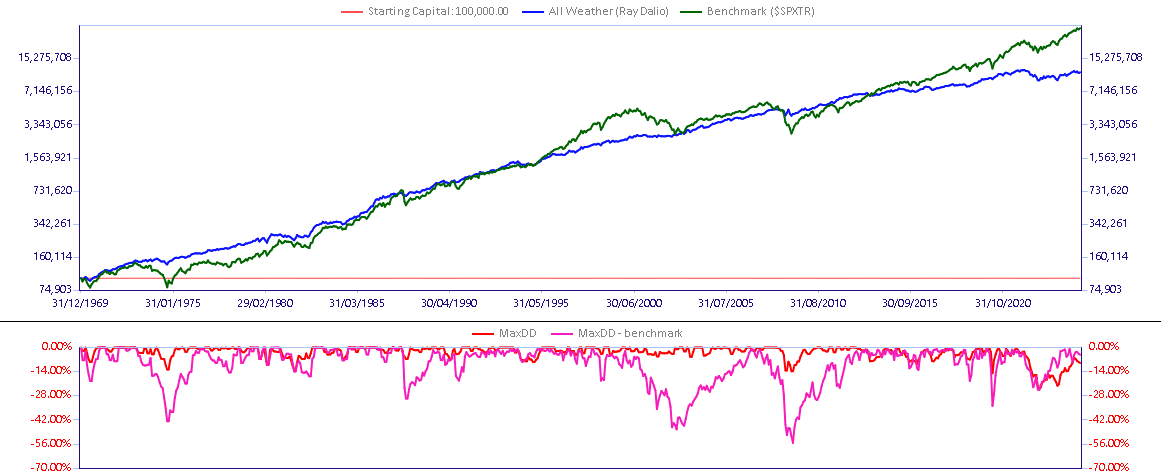
Bob Prince, the longtime Co-CIO of Bridgewater, put out a research piece today that resonated with me. The report was a page or two long, but in one sentence he captured the essence of founder Ray Dalio’s key principles and the genesis of the All-Weather Fund.
Prince said, “Don’t be defensive.”
He was saying that, as we don’t know what is going to happen in the markets, we need to build a portfolio that can handle all situations. Hence all-weather. This is obviously easier said than done, but is so empowering. Instead of feeling like a victim of the current market regime, this approach allows you to get on with things and be proactive. Love it.
While he didn’t say this, you can use the same logic to suggest that he believes you shouldn’t be offensive either. Sit with this idea for a while; it is powerful.
This chart shares just what robustness (all-weather) looks like. It might not be the best performer in absolute numbers, but it is incredibly consistent with smaller drawdowns than most strategies. Do this for a few decades, and you might also be a billionaire.
S2N observations
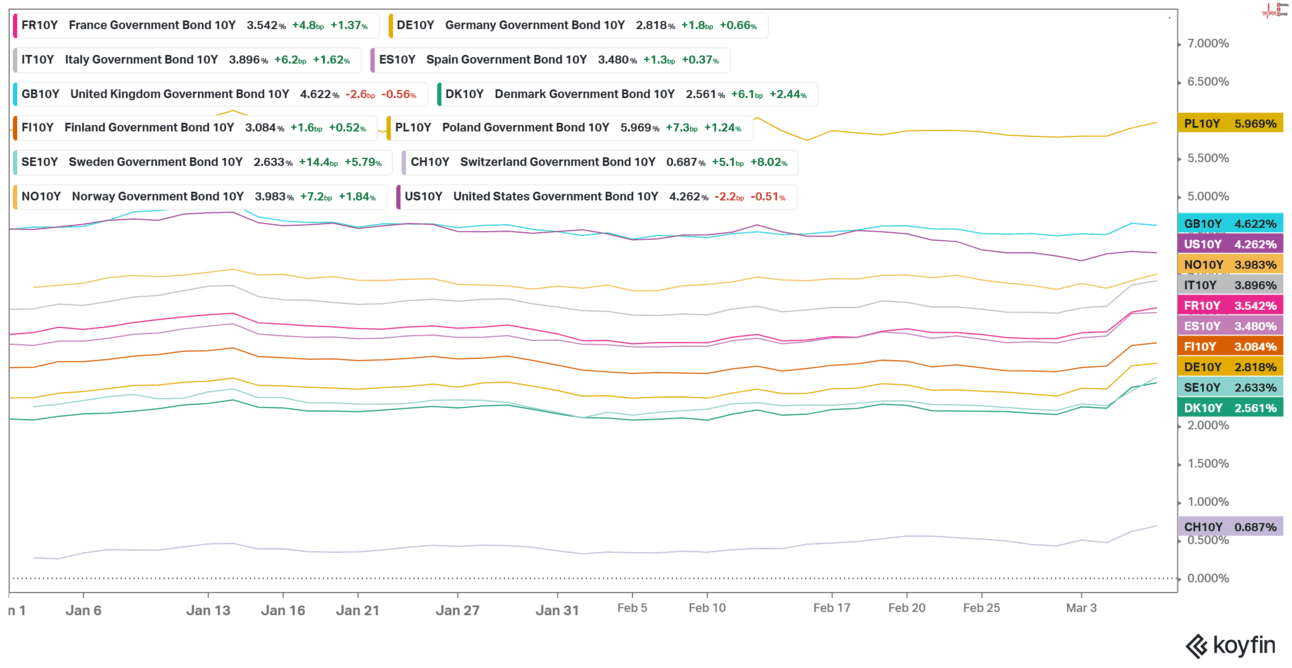
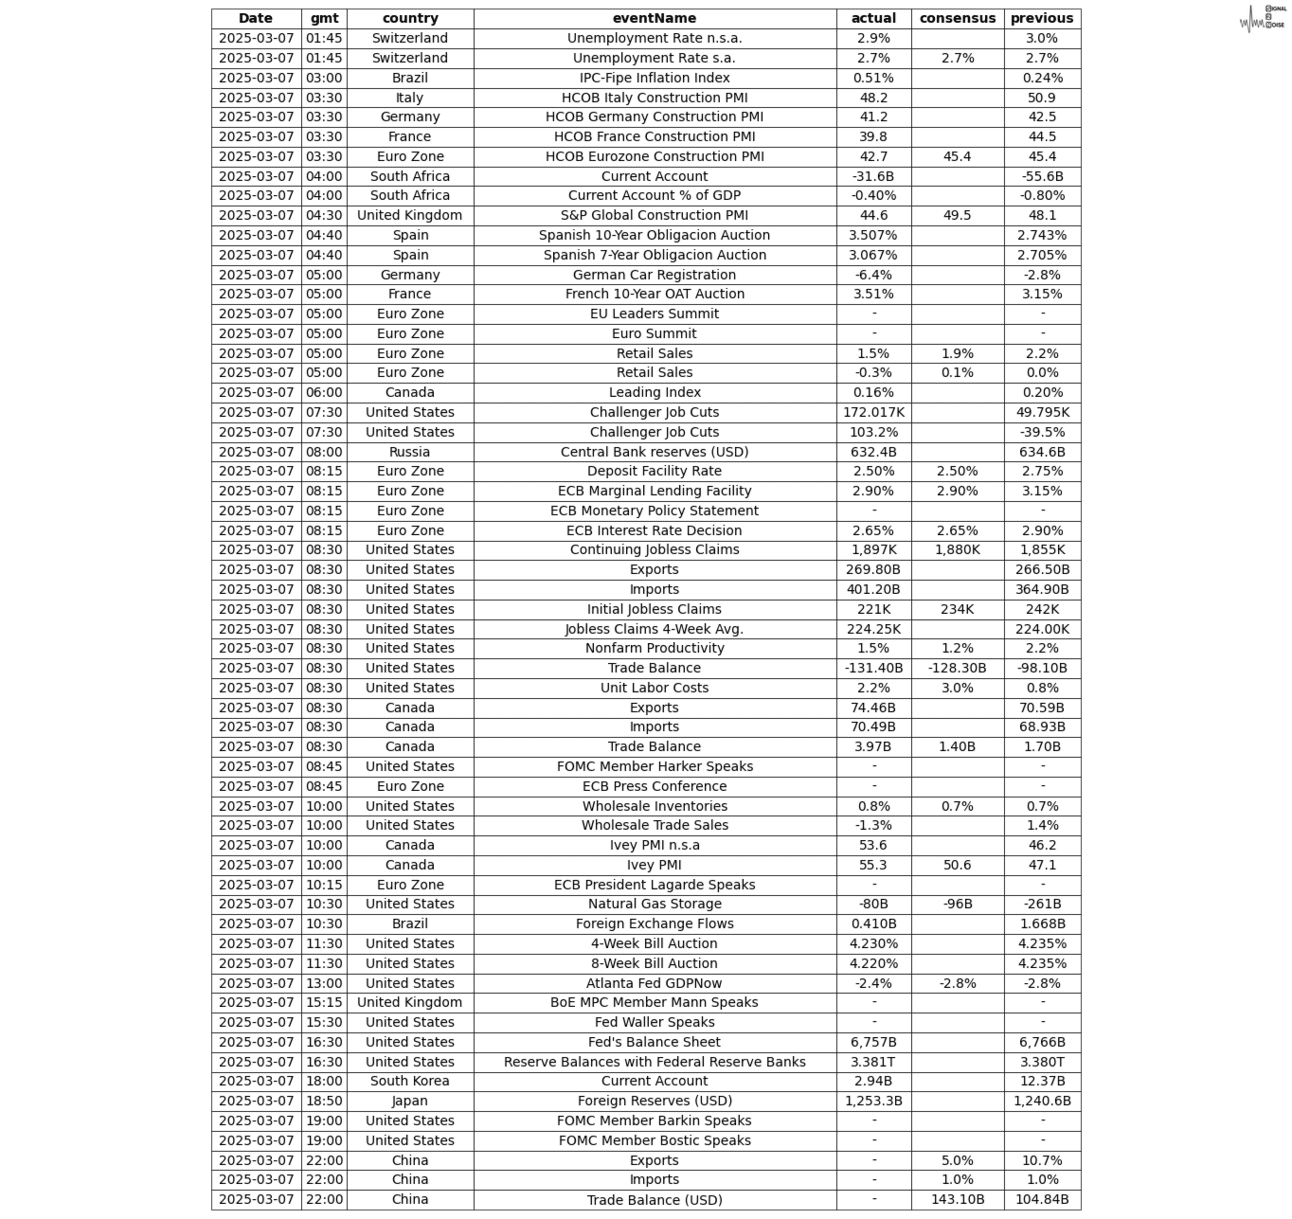
The ECB lowered rates to 2.50% to help stimulate struggling European economies'. This week we witnessed the announcement of major defence and infrastructure government spending programmes. Germany seems to have finally purged the memories of the Weimar Republic’s hyperinflation period and is now ready for spending. Hey, big spender.
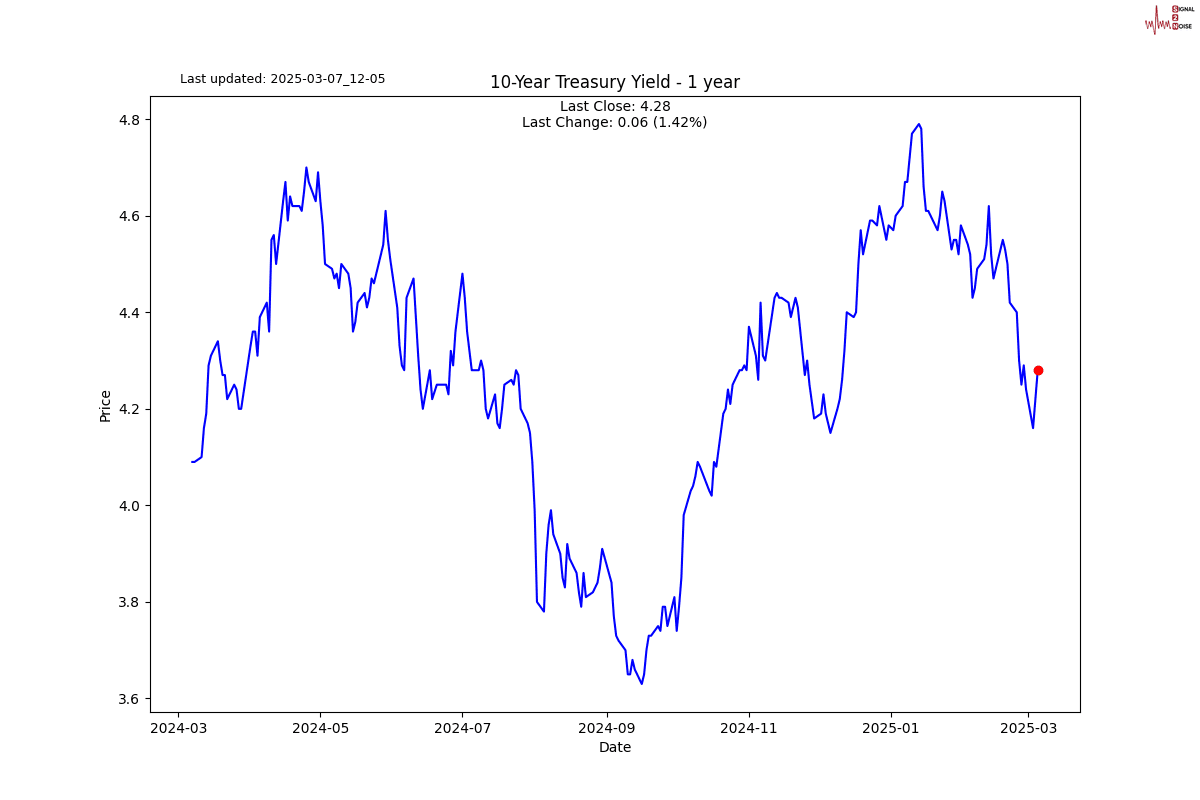
Here is a look at Europe’s 10-year bonds. I threw the US and UK in for comparative purposes. The Polish and UK 10-year bonds are the only ones trading above the US yield; the rest are well below.
In a world that is competing for sovereign debt bond investors, I would think that yields in Europe are too low in comparison to the US, which is still the only global reserve currency. Especially in a world where governments are borrowing big like they are planning to do.
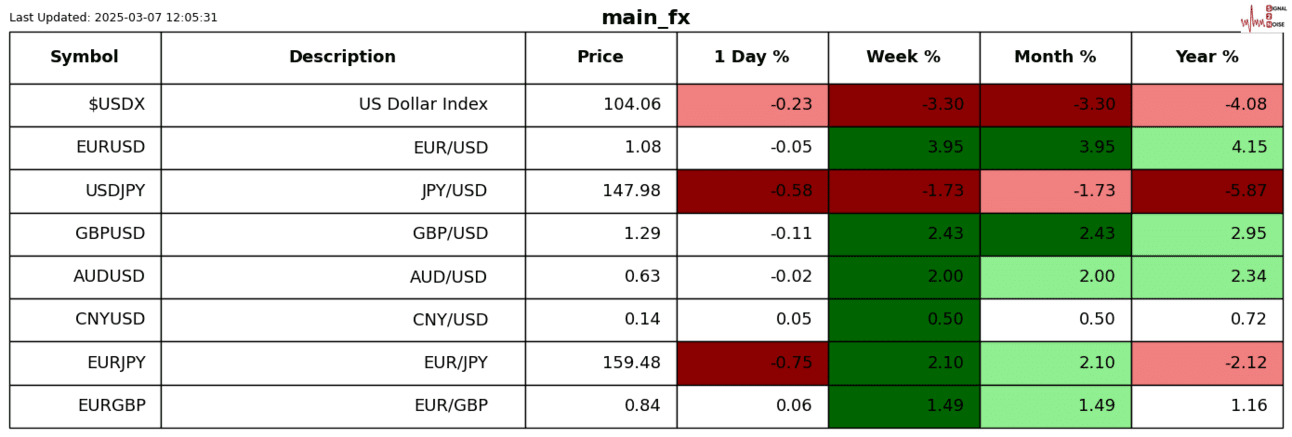
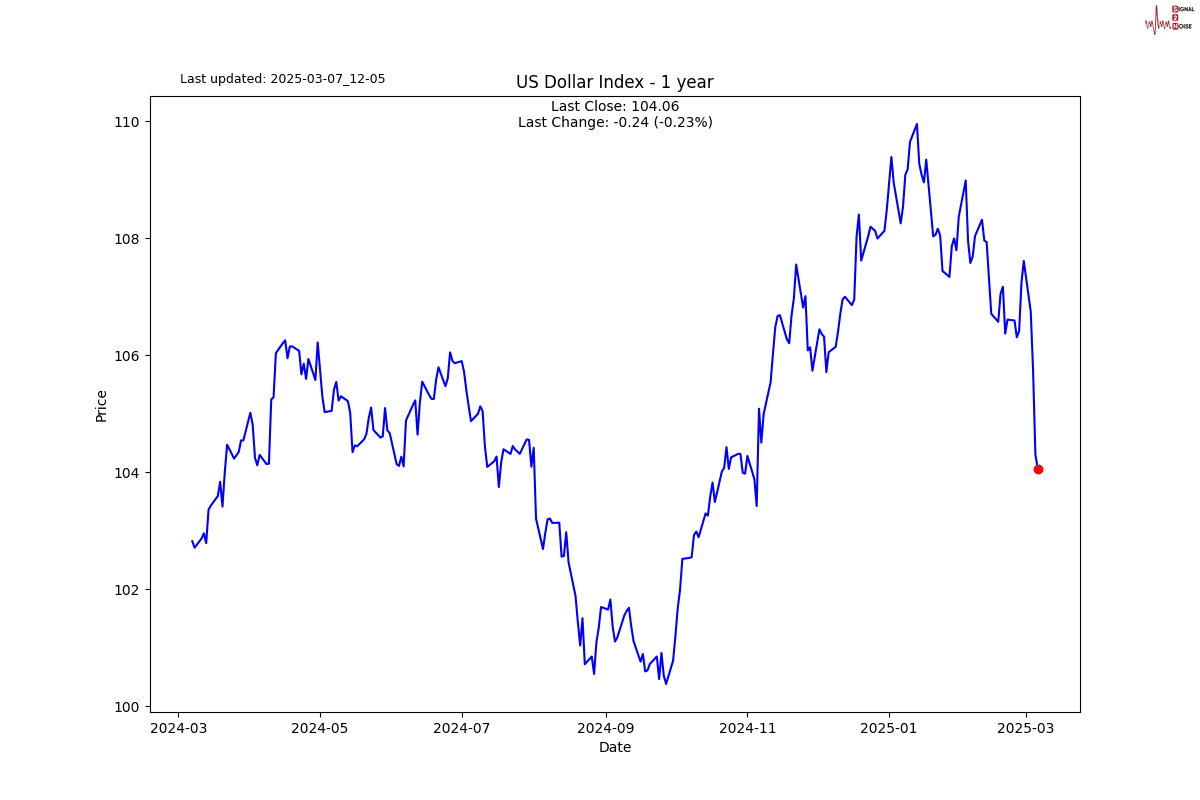
Speaking of the dollar, it continues to weaken. I failed to mention yesterday that a weak dollar will add further pressure on US inflation. I will spare you the repition of yesterday’s big news that the trade deficit widened with new import growth records.
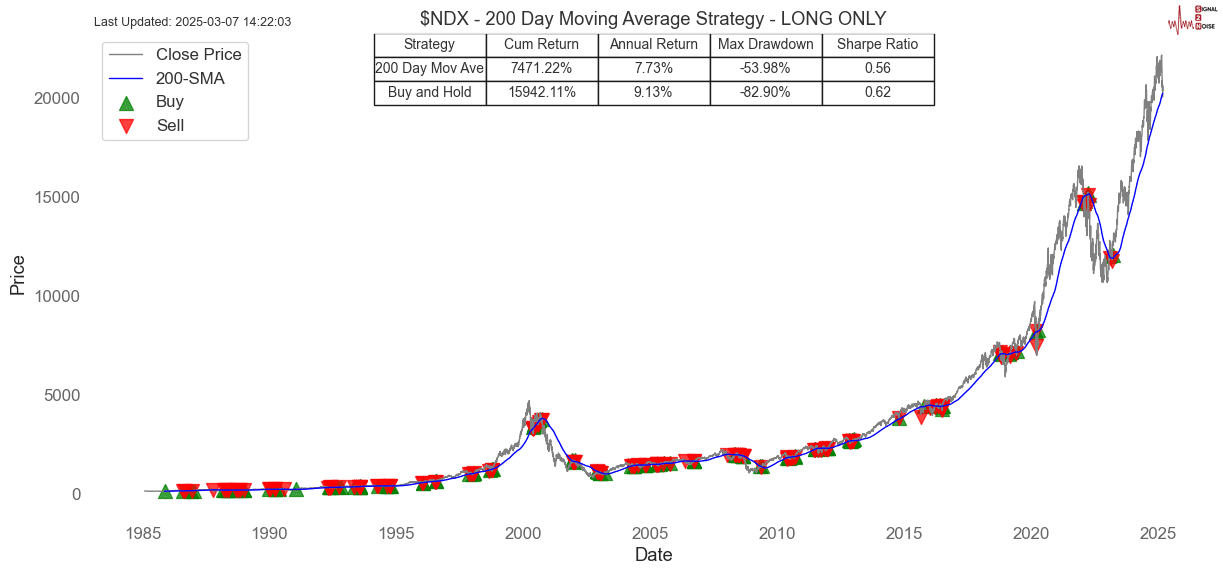
The Nasdaq 100 broke its 200-day moving average yesterday. The day after the US dollar broke its 200-day. I present 2 backtests when this happened in the past. The long-only version shows the performance of a strategy where you simply exit the market and go to cash when a break below the 200-day simple moving average happens. If you are a long-term holder, you would be better off simply buying and holding. A break below the 200 day is not an alpha-generating signal.
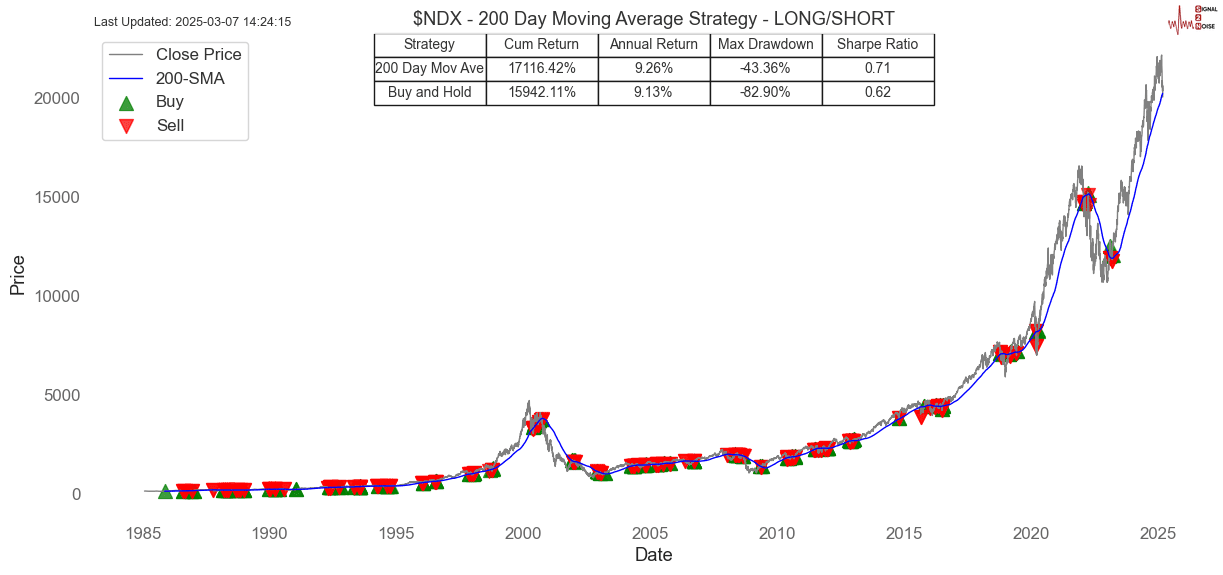
For the more active type of investor who wants to go short when a cross below the 200 happens, this is an alpha-generating risk-adjusted strategy.
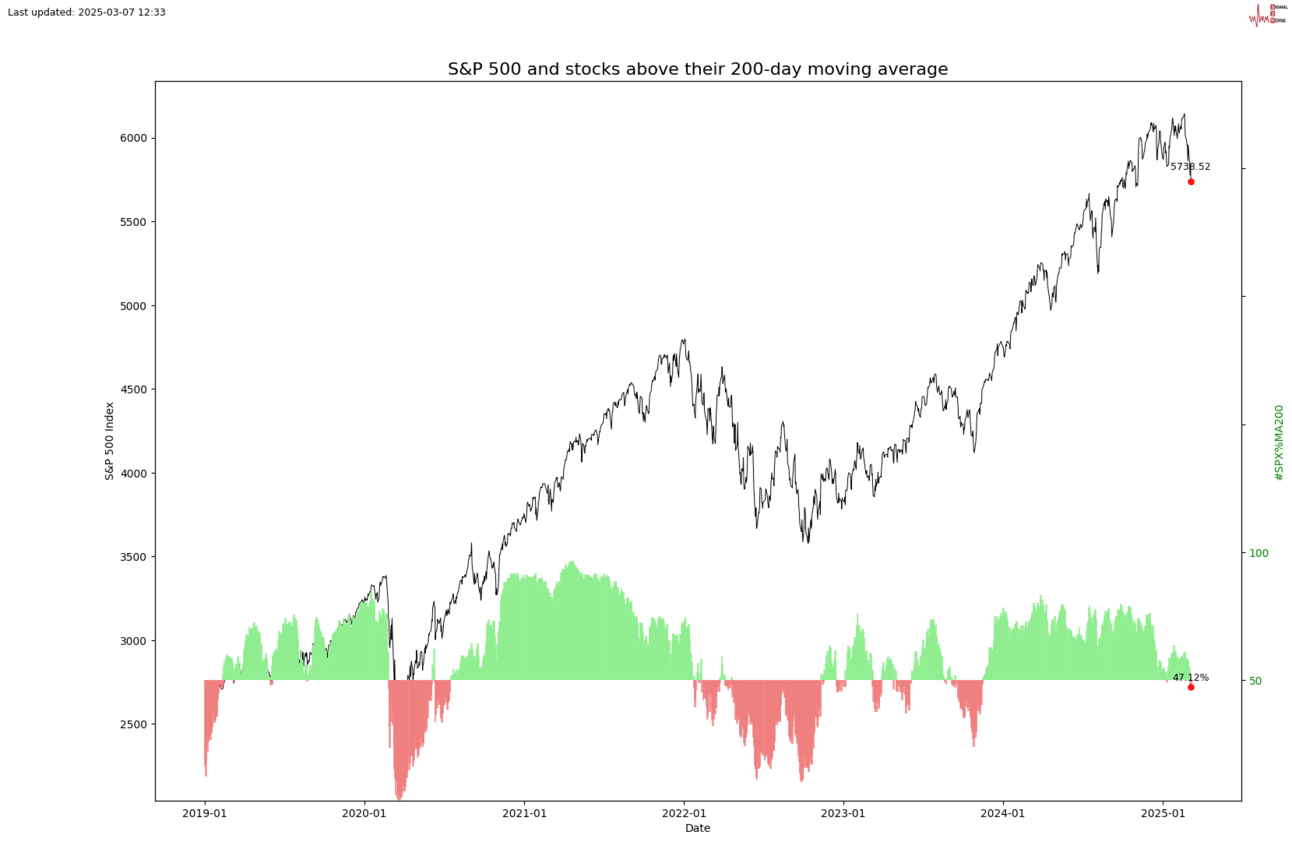
Speaking of 200's, here is a look at the number of companies in the S&P 500 who are below their respective 200-day moving averages. If you strain your eyes, you will see we have just dipped below 50% with a small red 47%.
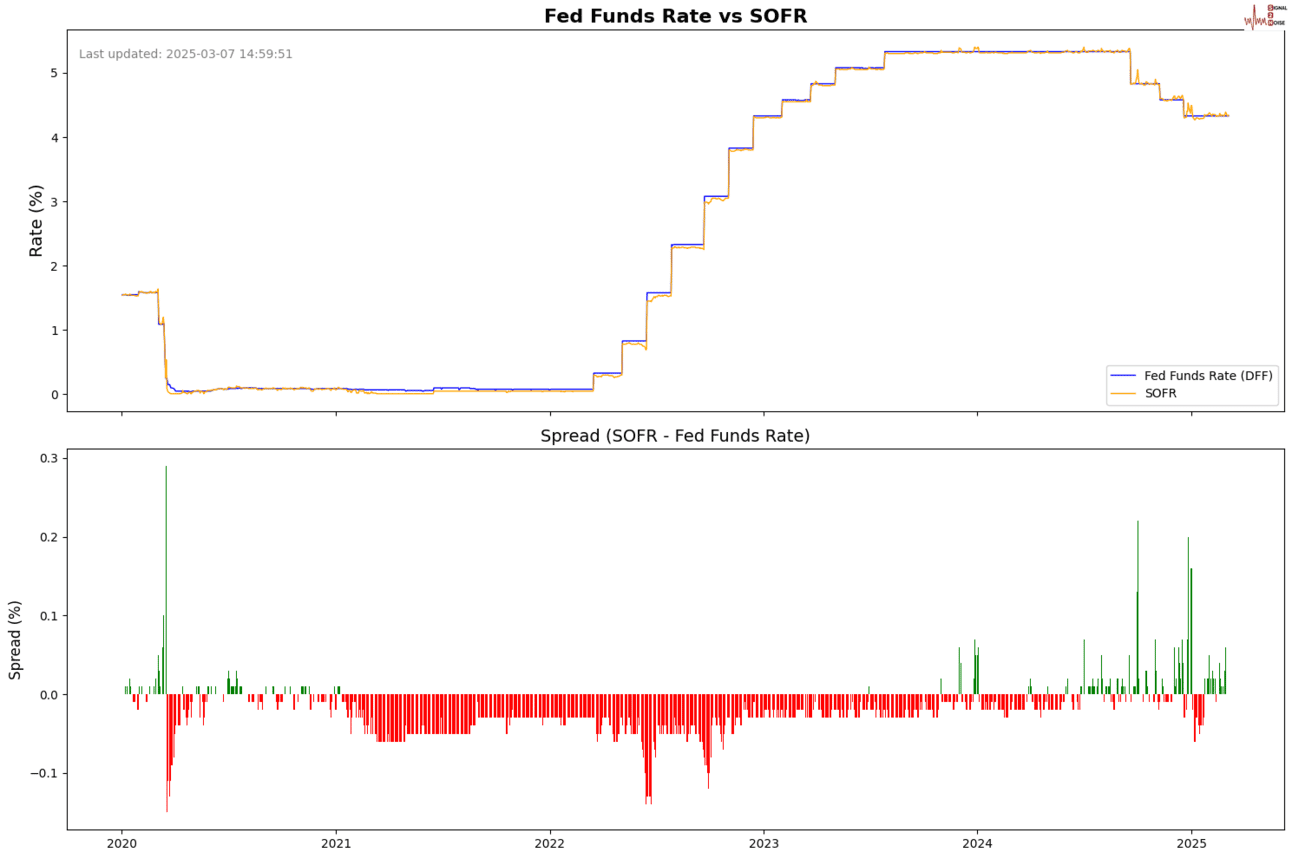
I have started tracking something new as I am looking for potential liquidity concerns. I am now tracking the difference between the SOFR (secured overnight financing rate) and the FFR (Fed Funds Rate). The SOFR is what the banks lend to each other with Treasuries as security. The FFR is the rate the banks lend to each other against unsecured reserves.
The green spikes are potential liquidity shortages where SOFR trades above the Fed’s suggested rates.
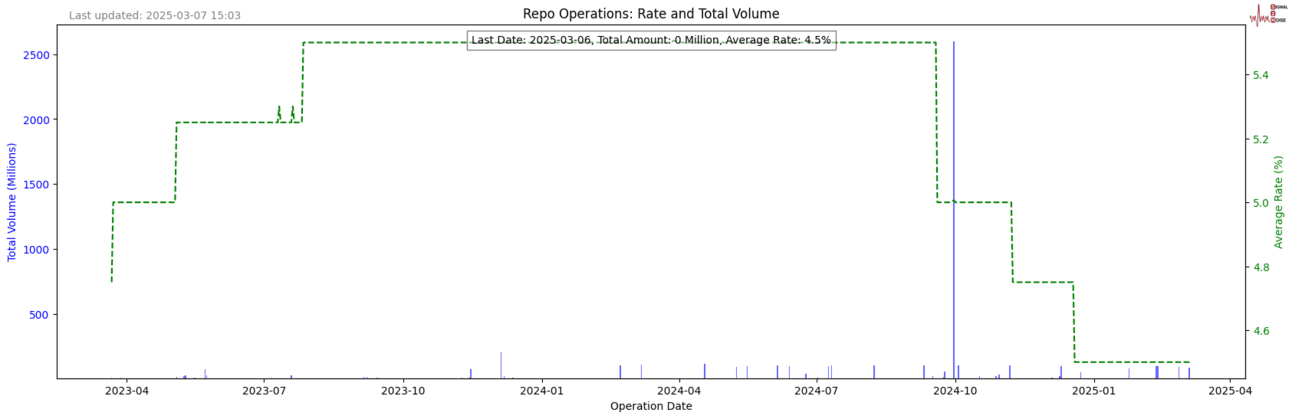
The monetary system is complex, so just to complete this picture of potential liquidity indicators. The repo rate is your classic. I source my data from the NY Feds API; it has this damn last 500-day limit so you cannot see the 2019 liquidity crisis.
You only really need to concern yourself with the blue bars. On the 30th of September last year we had a wobble, but Jerome had the systems back and his bro’s pumped a couple of billion to ensure everyone was chillaxed.
If the system gets its panty’s in a bunch, I am pretty sure we will see it here.
We are heading towards the end of a busy week. I am surprised I managed to write today’s letter. We got home from a wedding after 1am. I am buggered.
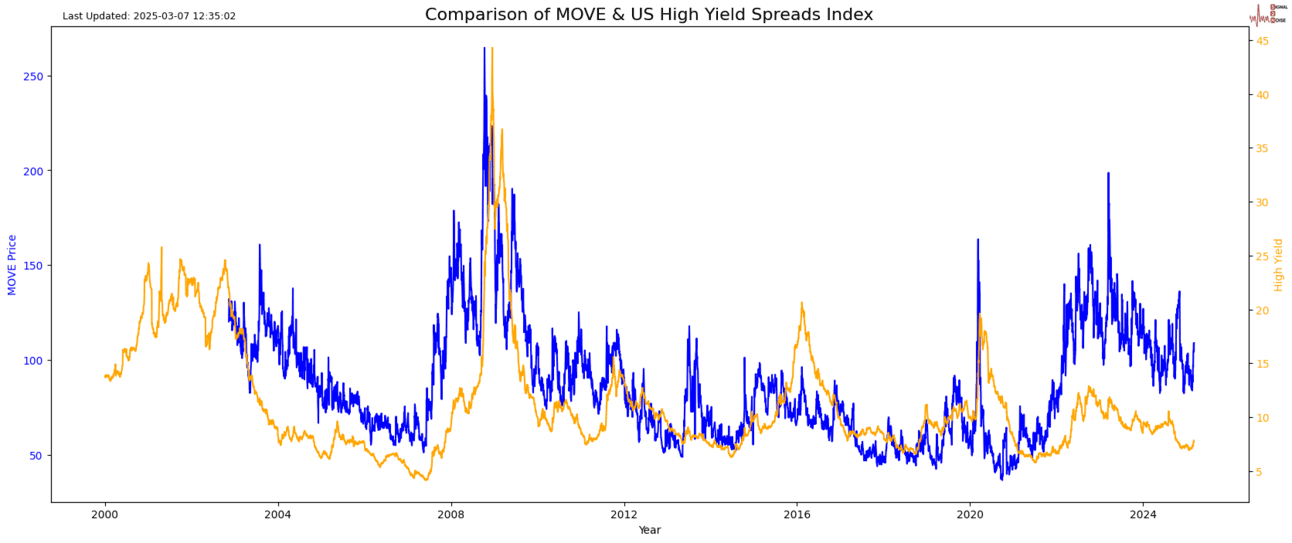
Remember what I have been saying about the junk bond trade? Well, it is looking as good as ever. Bond volatility—MOVE Index (blue line) has picked up a bit, but the spread of junk relative to quality bonds is still ridiculously small. If the uncertainty the world is in translates into more bankruptcies in the US, we should see junk yields spike much higher.
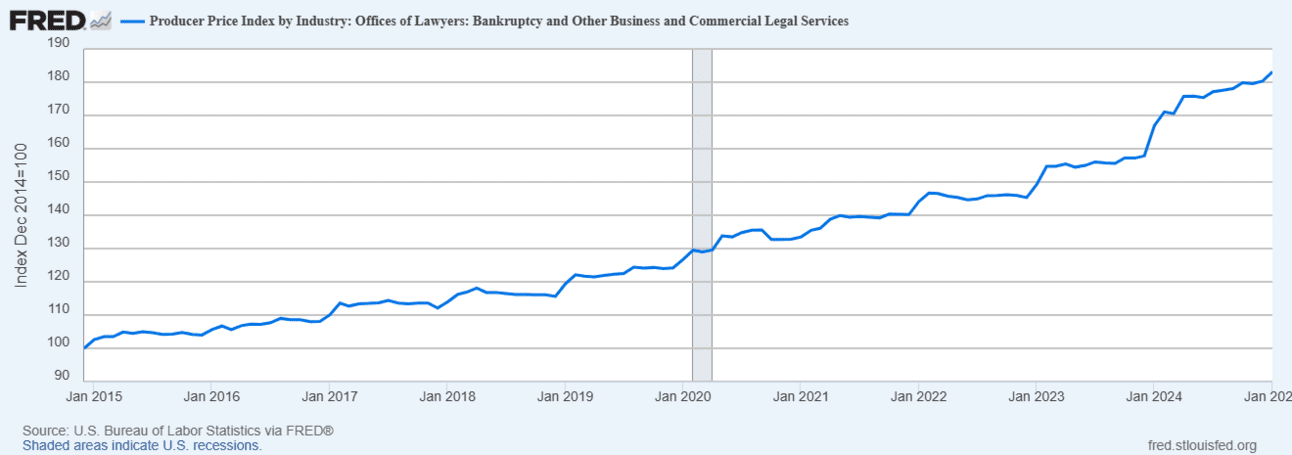
This is the latest look at bankruptcy in the US. It is heading in the wrong direction. Stay tuned for cracks in the junkyard.
S2N screener alert
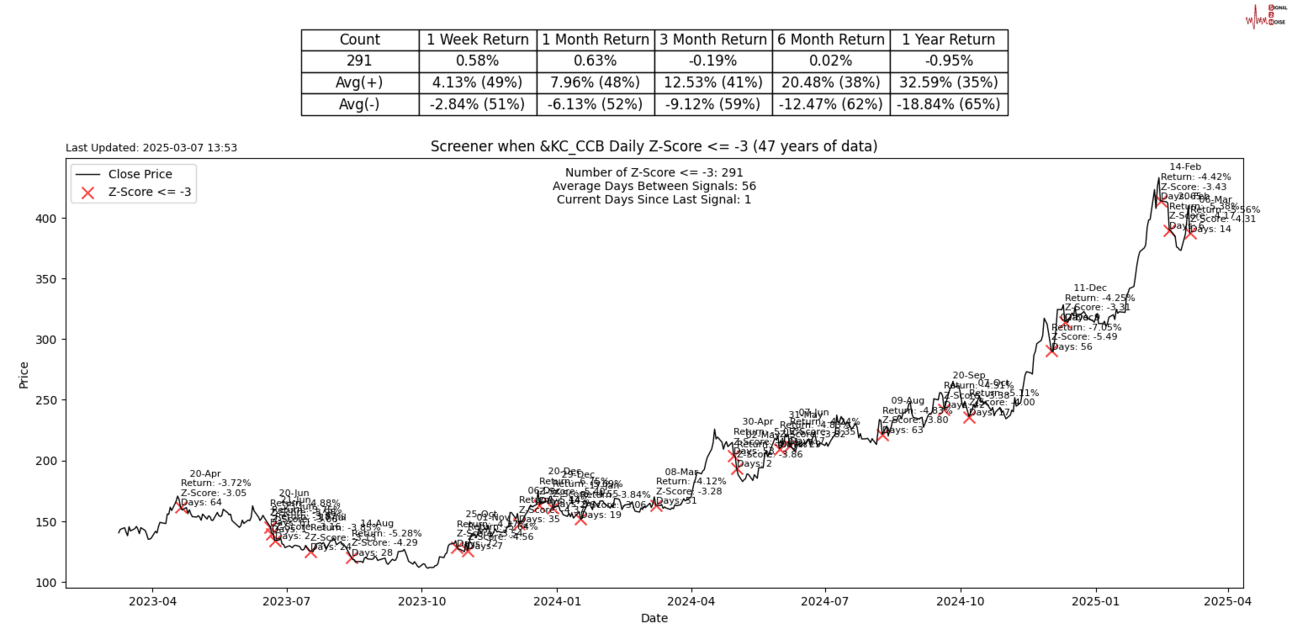
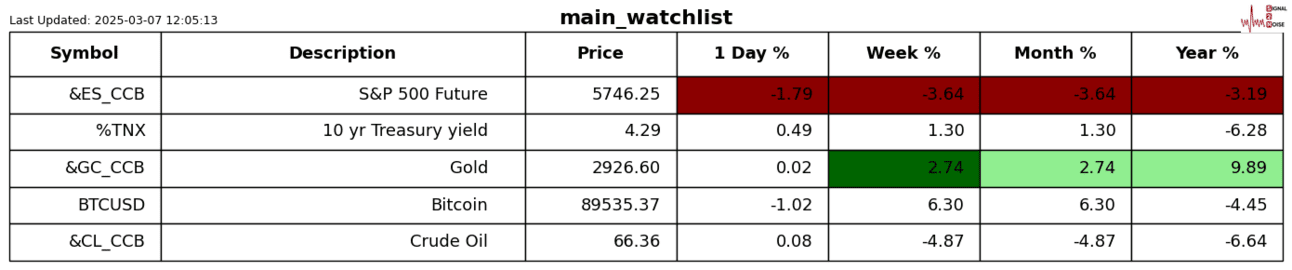
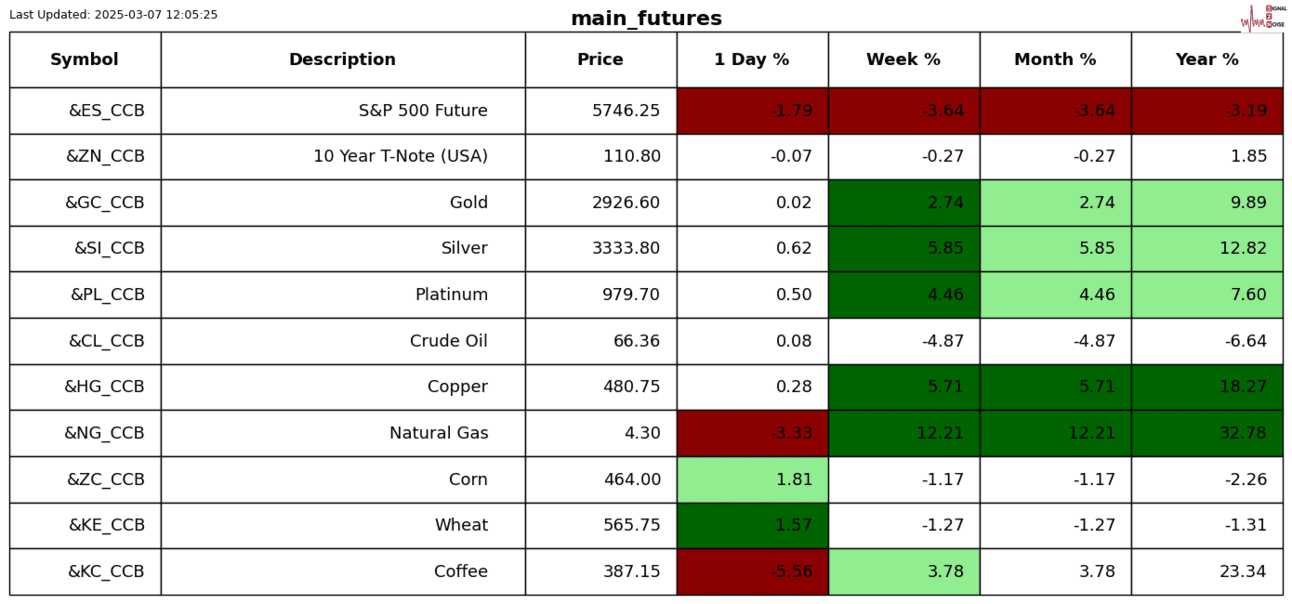
Coffee is off its highs, with a 3 sigma down move.
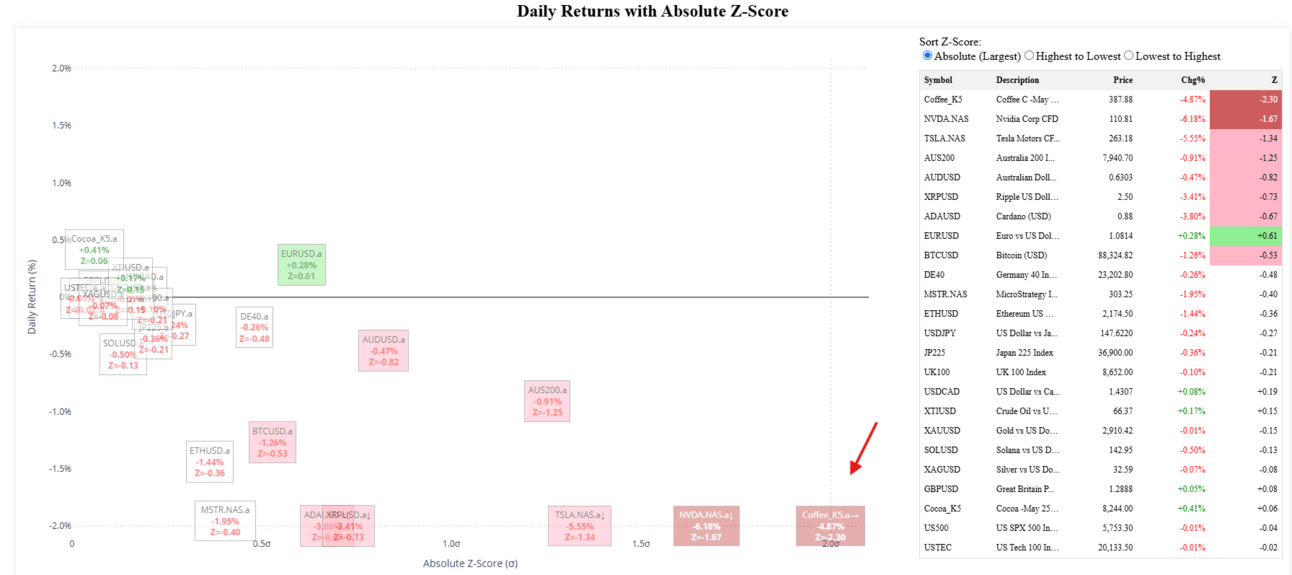
Just to show off my dashboard that I am encouraging you all to checkout. Coffee is currently in the worst spot on the board.
I feel like I am suffering from verbal diarrhoea. One more for the road.
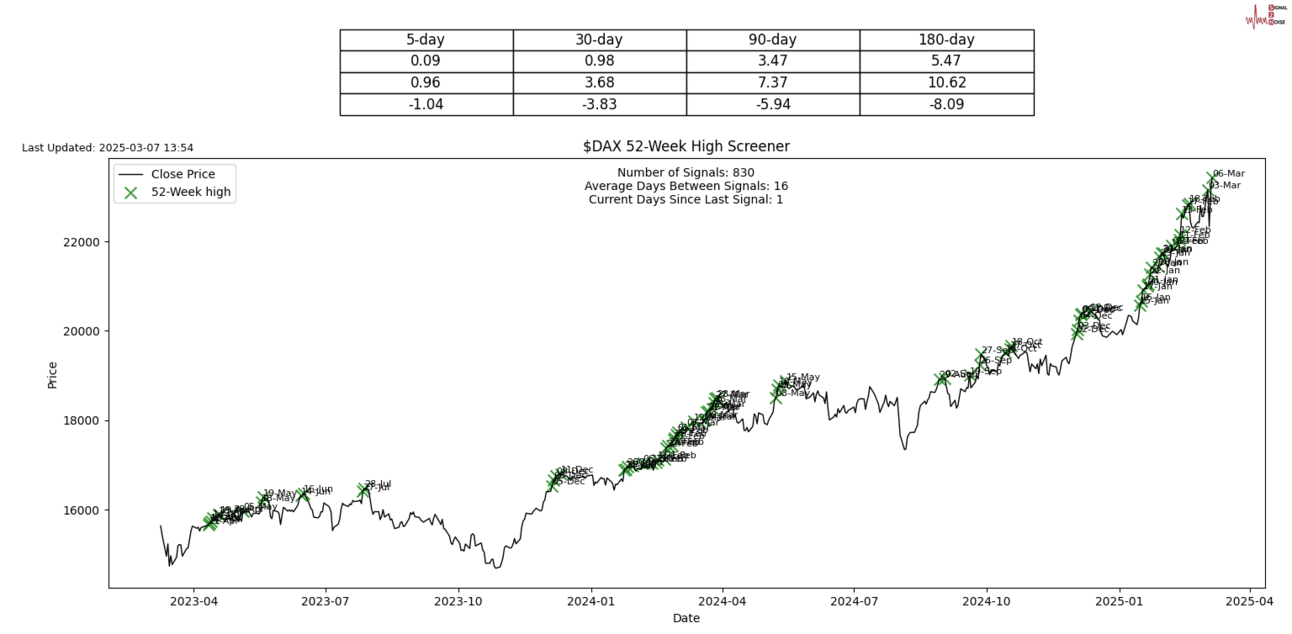
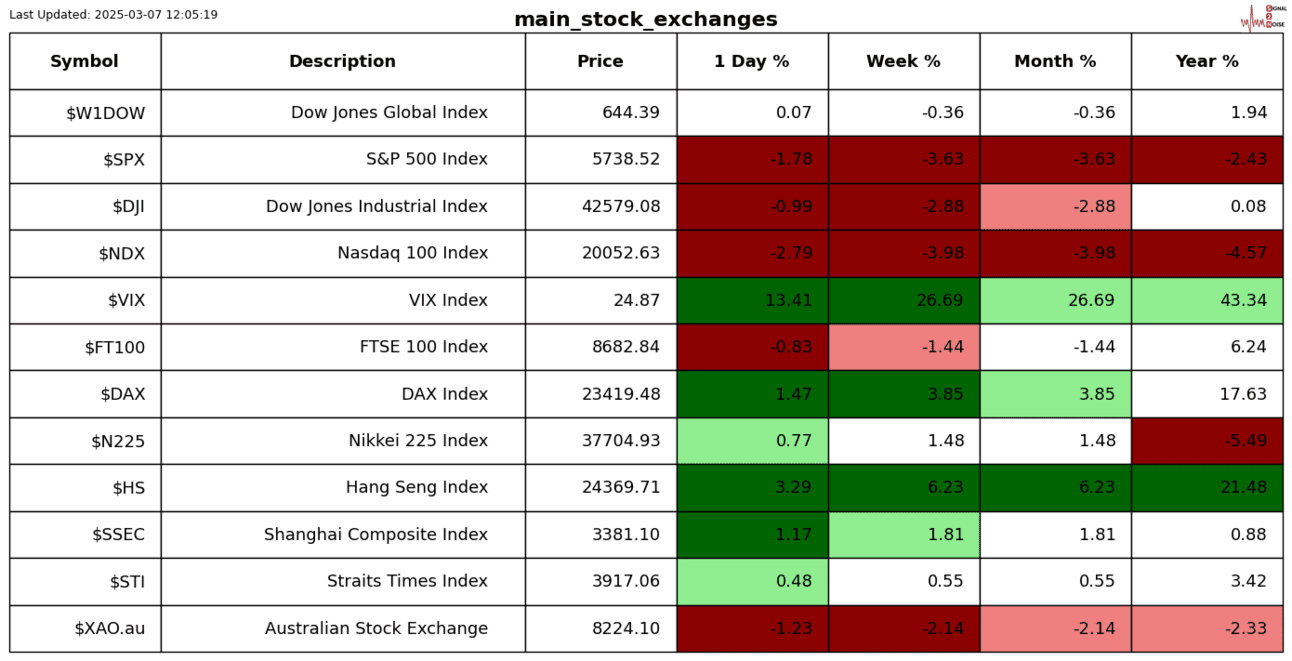
The Dax stock market loved the news that their government wants to spend a trillion euros on defence and infrastructure. My 52-week high screener triggered a Dax alert, but it is also an All-Time high.
Have a great weekend. Last Saturday afternoon I slept for 5hrs I was so tired. I am might beat it this weekend.
S2N performance review
S2N chart gallery
S2N news today
Author

Michael Berman, PhD
Signal2Noise (S2N) News
Michael has decades of experience as a professional trader, hedge fund manager and incubator of emerging traders.


