Dollar weakens further on FOMC minutes

Market Overview
The rally on gold is approaching a key technical barrier as the dollar remains weak in the wake of last night’s FOMC minutes. The Fed seems intent to push ahead with tightening monetary policy despite the concerns of “many” on the committee were concerned that low inflation may be “persistent”. Whilst this is unlikely to scupper expectation of a December rate hike, it could question the pace of tightening in 2018. This puts added focus on Friday’s CPI data which is expected to show core CPI rising for the first time this year. A negative surprise on core CPI could accelerate this dollar correction. The impact of the FOMC minutes was to flatten the Treasury yield curve, with the 2s/10s spread dropping further as shorter dated (2 year) yields held up relatively well whilst the longer dated (10 year) yields fell. The dollar subsequently continues to weaken and has now broken through a key technical level against the euro (above $1.1820 on EUR/USD), whilst Cable and gold also continue to rise. Political risk from the Catalonian independence drive seems to be less of an issue and this is helping to support the euro too. All the while, Wall Street continues to make good ground into all-time highs as Q3 earnings season approaches in the US.

Wall Street closed once more at all-time highs with the S&P 500 +0.2% at 2555, whilst Asian markets were also broadly positive (Nikkei +0.3%) whilst European markets look a touch more cautious ahead of a key speech from ECB President Mario Draghi today. In forex, the dollar is weaker across the majors with the Aussie and Kiwi mildly outperforming. In commodities, the dollar weakness continues to bolster gold by a further $4 whilst oil is just paring some of yesterday’s gains, around half a percent lower.
Once more it is a fairly quiet European morning session for economic data. The action subsequently does not really get going until the US PPI inflation at 1330BST. Factory gate inflation is expected to have picked up marginally on the headline PPI to +2.5% (from +2.4%) whilst the core PPI is expected to be flat at +2.0%. The Weekly Jobless Claims are at 13330BST and are expected to be 251,000 (down from 260,000 last week). The EIA inventories are a day delayed this week due to Columbus Day and are at 1600BST. The crude stocks are expected to have been in drawdown by -2.2m barrels (last week -6.0m) with distillates a drawdown of -2.3m barrels (last week -2.6m) and gasoline stocks a drawdown of -1.3m (having shown a build of +1.6m barrels last week). There are also a number of central bankers to look out for today. The ECB’s Mario Draghi is speaking at an event in Washington at 1330BST along with FOMC’s Lael Brainard (voter, dove). The FOMC’s Jerome Powell (voter, dove/centrist) is also due to speak at 1330BST.
Chart of the Day – EUR/NZD
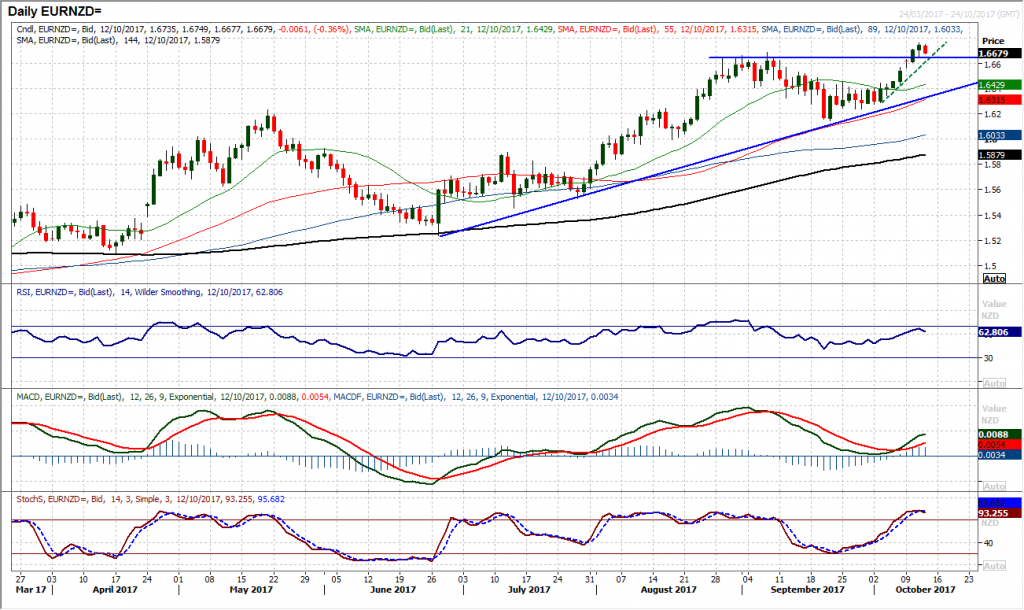
The Kiwi has been one of the worst performing major currencies in recent weeks. Even as the dollar has come under corrective pressure, the Kiwi has barely managed to make any headway in a recovery. Now we see with the euro performing well this has driven a sharp move higher on Euro/Kiwi above the key resistance of 1.6687 to a new high dating back to May 2016. The strength of the breakout with a series of bullish closing candles and filled gaps suggests that the bulls are now on a key run higher. The momentum indicators are also backing the move with the MACD lines recently crossing higher, the Stochastics strongly configured and the RSI into the mid-60s with upside potential. The next resistance is not until the May 2016 high at 1.6930 and beyond there the resistance is light all the way until 1.7220/1.7270. With a run of higher lows in each of the past seven sessions, the strategy is now to buy into intraday weakness with breakout support 1.6650/1.6687. Today’s early drop back looks to be an opportunity. The hourly chart shows any unwind towards neutral on the hourly MACD is a chance to buy, whilst an 8 day uptrend is supportive around 1.6620 today.
EUR/USD
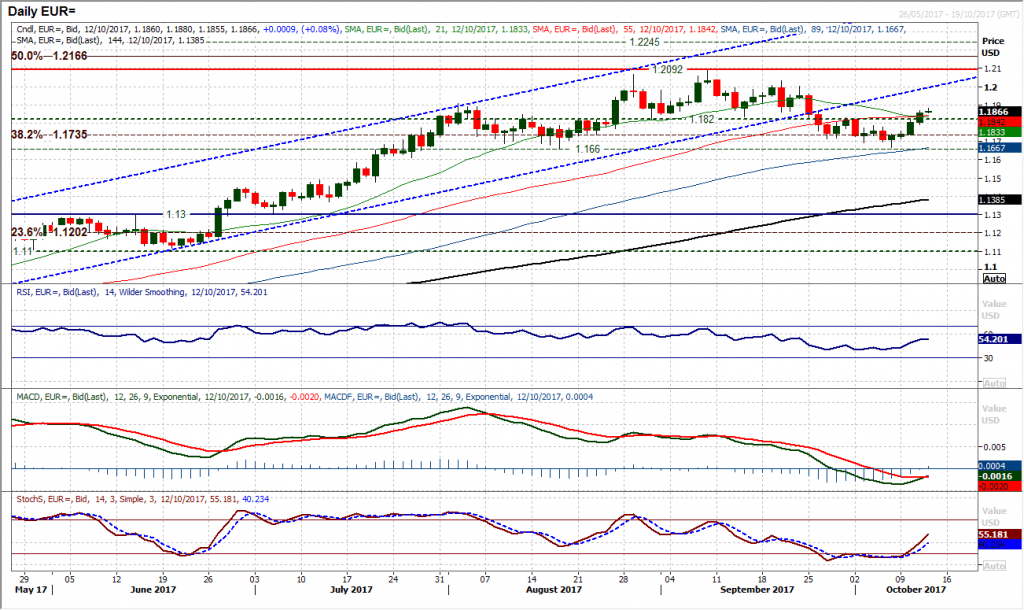
The technical outlook on the pair continues to make a marked improvement as a fourth consecutive positive candle was completed yesterday and the market closed back above the near term resistance at $1.1820. This is a significant barrier that has been overcome now as this old floor that had been in place for around four weeks during late August/early September had become a key basis of overhead supply. Coupled with the improvement seen in the momentum indicators, the outlook suddenly looks far more positive. A bull cross on the MACD lines, the RSI rising above 50 and the Stochastics also rising reflect an improving chart. With a succession of higher daily lows, intraday weakness is a chance to buy now. There is an intraday low at $1.1840 with the neckline now a pivot support at $1.1820. The next real resistance is not until around $1.2000 again. How the bulls react to unwinding back to the neckline could now be the next key test for the outlook.
GBP/USD
With three bullish candles now posted in succession, the three week downtrend has now been broken and the outlook for Cable is suddenly improving once more. The early positive move today has continued that rebound and is now pushing through the confluence of technical resistance between $1.3220/$1.3265 (downtrend, 50% Fib level and old key high). The confirmation of this breach would come on a move above the early October minor resistance at $1.3290 and is the next test today. The momentum indicators are improving with the Stochastics having crossed higher along with the RSI rising back above 50 and the MACD lines looking to bottom around neutral. This all suggests that in the least, the corrective phase for sterling has been contained and there is increasing selling pressure through the dollar now near term. There is still plenty of overhead supply that could prevent a sustainable rally but for now the near term outlook is one to buy into weakness. Yesterday’s low at $1.3175 has left decent support now with a band of support $1.3175/$1.3225. Above $1.3290 opens $1.3340.

USD/JPY
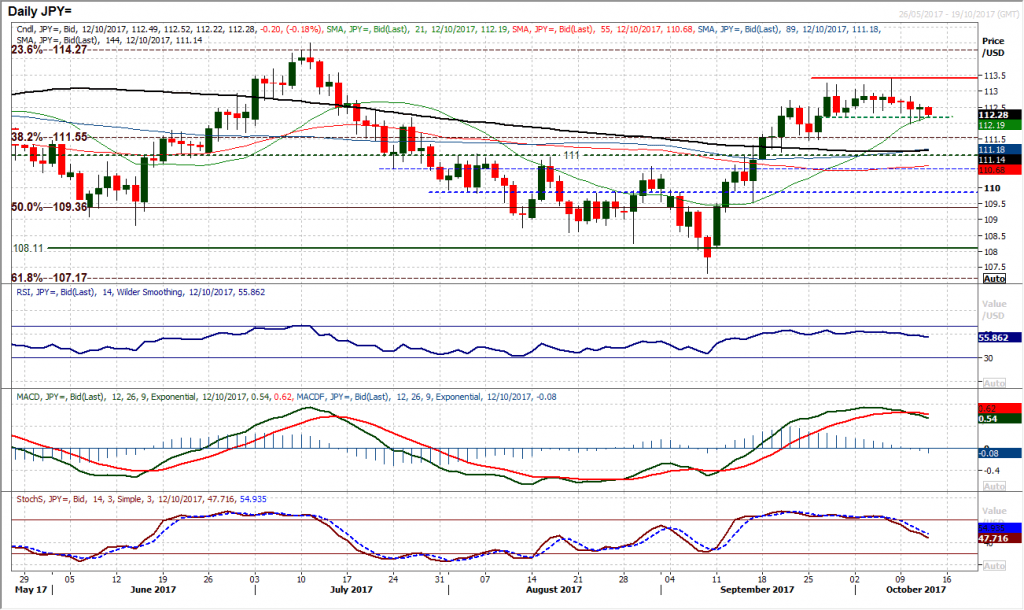
The pressure for a downside break continues to mount as once more we saw 112.20 breached on an intraday basis only to survive into the close. However again we see the early move lower testing this old floor and with the momentum indicators making a series of near term negative signals a breach seems to be imminent. The Stochastics are decisively tracking lower now whilst the RSI is dropping back and the MACD lines have now formed a bear cross. A close below 112.20 would be a small rolling top completed and would imply around 120 pips of downside back to the key medium term pivot at 111.00. The hourly chart now shows the market taking a more bearish near term configuration as the hourly RSI is failing around 60 and the MACD lines are struggling around neutral. A breach of the intraday low at 111.98 would also open the downside with 111.45 initial support. The intraday high at 112.55 is initial resistance with 112.82 adding to what is becoming a series of lower highs now.
Gold
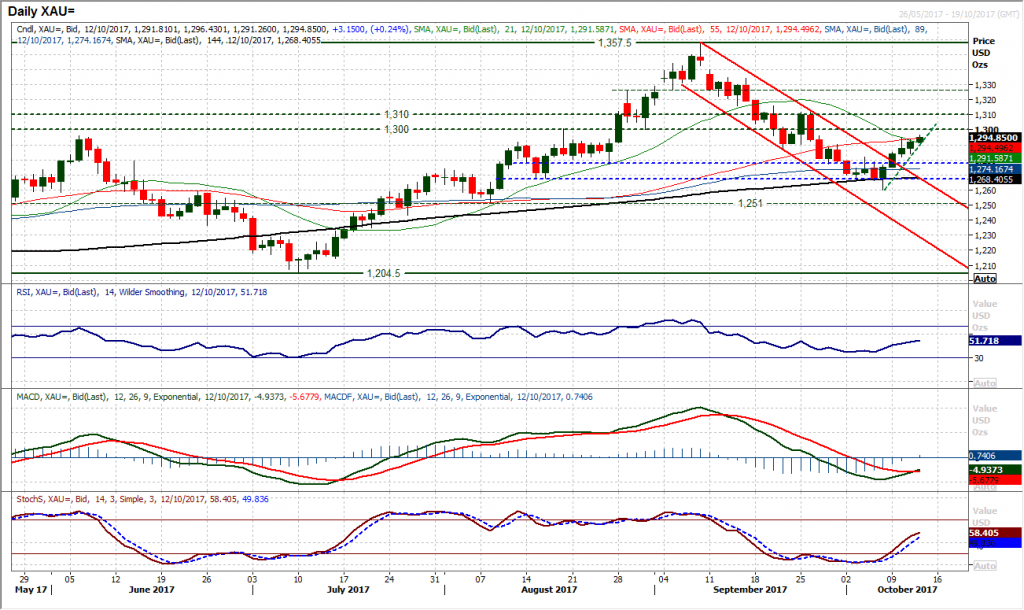
As the dollar sells off we see gold rising. The rebound has now posted four consecutive positive candlesticks and is pushing steadily higher. The big test is ahead though, with the long term pivot band looming overhead at $1300/$1310. Momentum indicators are setting up positively for the test though, with the RSI pushing to a three week high back above 50 this morning, whilst the Stochastics are rising and the MACD lines are set to complete a bull cross. This final factor could be the most crucial, with all of the bull MACD crosses in 2017 being the precursor to a renewed trend higher. The hourly chart shows positive momentum configuration with the hourly RSI and MACD lines all positioned far more positively. Yesterday’s reaction low at $1284 is now initial support, coming in above a near term pivot at $1279. Reaction to the long term pivot band $1300/$1310 will be key for the near to medium term outlook now for gold. The rebound high at $1313.50 is key price resistance.
WTI Oil
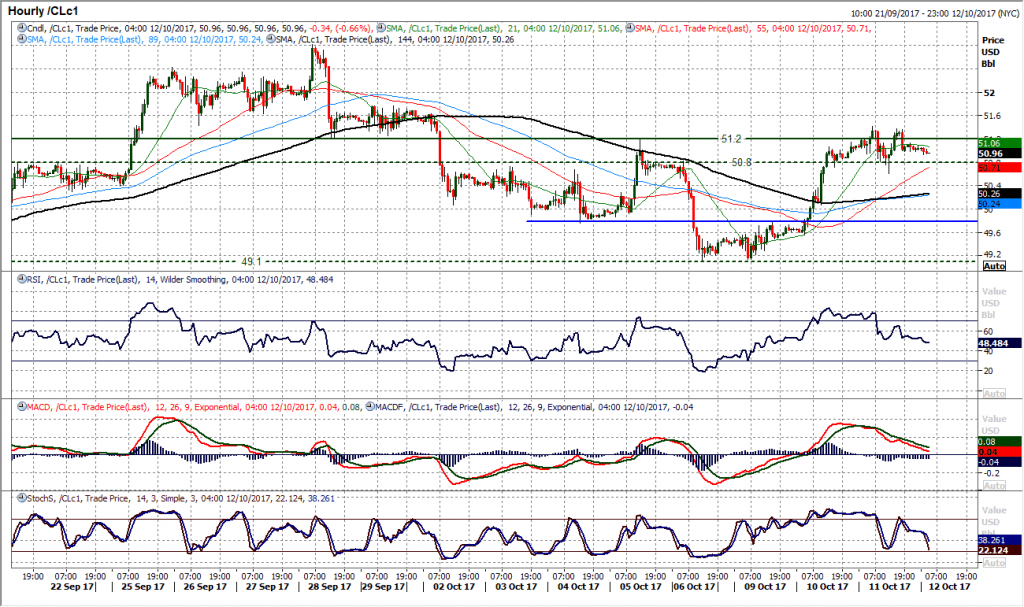
A breakout above $51.22 now looks to be turning the outlook more positively once more and building support above $50.50 will allow confidence to grow. Taking a step back from the near term noise and volatility, the medium term outlook is improving now. Holding above the support of the old seven month downtrend, with medium term momentum positively positioned and building support above $49.10/$49.20 is certainly giving the chart a more bullish configuration. This suggests that corrections are a chance to buy. The hourly chart shows yesterday’s slip to $50.60 was a near term unwind and should also help to give an opportunity. $50.80 is a consistent turning point on the hourly chart and is an initial basis of support today. Resistance is now in at yesterday’s high at $51.42. An upside break re-opens $52.85.
Dow Jones Industrial Average
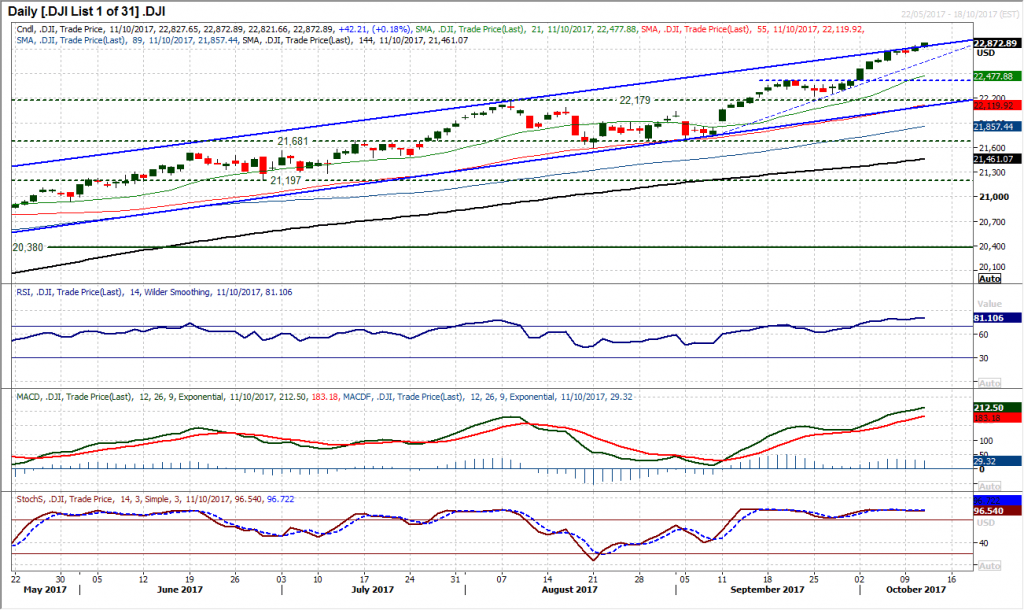
There is little reason to back against the Dow posting further gains currently as the market once more looks to push into new all-time highs. Yesterday’s session was a mild consolidation but the market remains positively set up on momentum indicators to suggest that intraday weakness remains a chance to buy. The market has consistently been hugging the 2.0 SD Bollinger Band which was yesterday rising at 22,915 and is a good near term gauge. The hourly chart shows strong momentum configuration and support 22,735/22,770.
Author

Richard Perry
Independent Analyst


