Dollar under corrective pressure again amid further Trump concerns

Market Overview
The recovery in the price of oil in the last week has been a boost to market sentiment and this has come with the dollar coming under increasing corrective pressure amidst data disappointment and more concern over Trump. Weaker US data is gradually becoming a trend, as the New York Fed manufacturing dropped to negative yesterday to put the dollar traders once more on the back foot. The recent pull back in Treasury yields has played into this dollar correction, and yields remain a driving force. However it was also interesting to see the S&P 500 rising again despite the dollar being under pressure. The oil rebound has certainly helped that, but unless Treasury yields start to pull higher again it could prove difficult to maintain upside momentum. Concern over the actions of Trump could also be a driver of caution, as reports have surfaced of Trump apparently sharing classified information with Russian Foreign Minister Sergei Lavrov. Denials have been swift, but it all feeds into the narrative of how maverick Trump runs his presidency, something that does not instil too much confidence.

Wall Street closed higher last night with the S&P 500 +0.5% closing at an all-time high of 2403. However, Asian markets have been more mixed overnight with the Nikkei +0.3%, whilst European markets are mixed in early moves. The forex markets show the dollar again under corrective pressure across the majors, with the euro and sterling both stronger ahead of key data releases. Gold and silver are also higher again with a weaker dollar, whilst the oil price continues its recovery, another 0.5% higher.
Today is the major day of the week for economic releases, with UK inflation, Eurozone growth and US industrial numbers all in focus. UK inflation data is released at 0930BST which are expected to show that inflationary forces continue to grow. The headline UK CPI is expected to increase to +2.6% (from +2.3% last month), furthermore, UK core CPI is expected to jump back to a three year high to +2.2% after having fallen back to +1.8% last month. Additionally, PPI input prices are expected to be strong at +17.0% only slightly back from last month’s +17.9%. The flash reading of Eurozone Q1 2017 GDP is at 1000BST and is expected to be +0.5% for the quarter and +1.7% for year on year. German ZEW Economic Sentiment is also at 1000BST and is expected to be +22.0 (up from +19.5 last month). US Building Permits are at 1330BST and are expected to be 1.27m (up from 1.26m) with Housing Starts at +1.26m (up from 1.22m). The US Industrial Production is at 1415BST and is expected to be +0.3% on the month and the Capacity Utilization increasing to 76.3 (from 76.1).
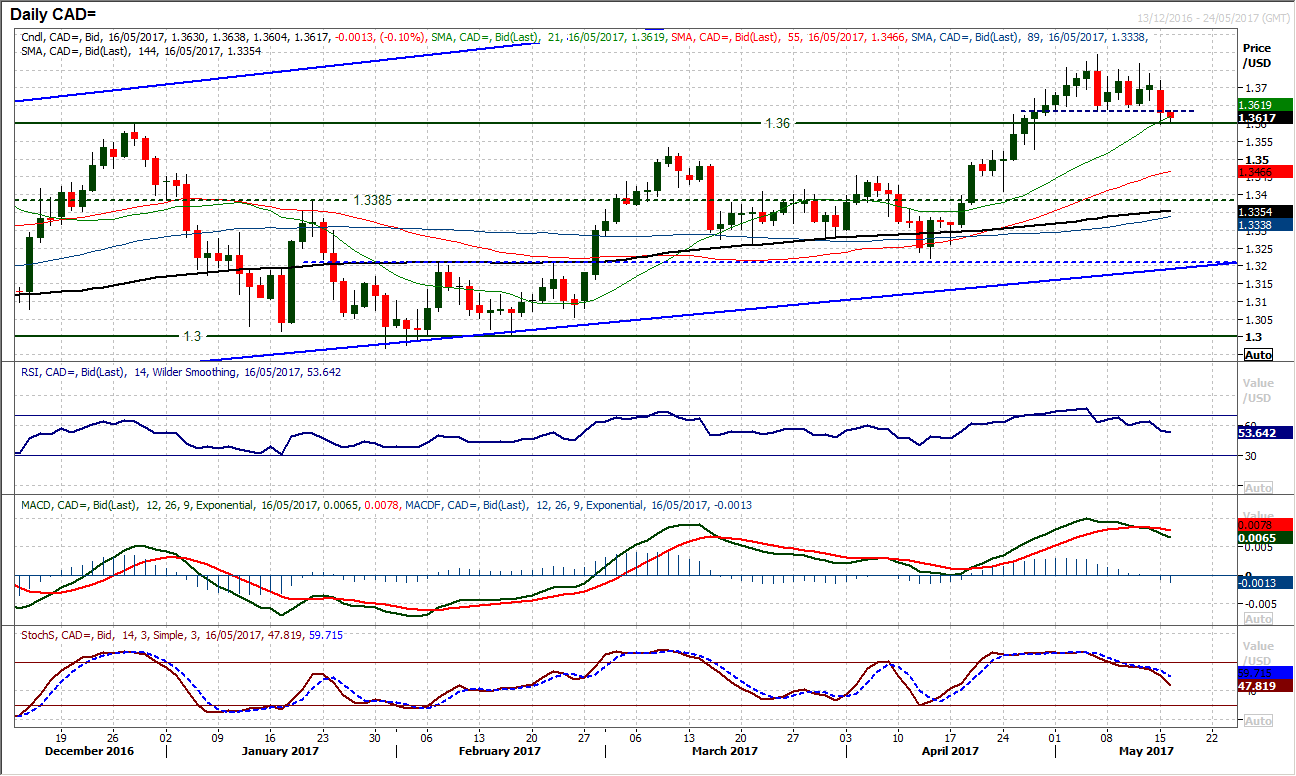
Chart of the Day – USD/CAD
The bears are testing the water again. Yesterday’s intraday dip below the near term support at 1.3640 was tested throughout the session and a closing breach reflects the bears gaining momentum. It was interesting that the support from the session low came almost at 1.3600 to the pip, however the market is having another go today. The long term breakout was 1.3600 from the twin November/December highs and is a key level of support that has held. However the near to medium term outlook is dominated by the bearish engulfing candle (bearish key one day reversal) from 5th May. This initial negative indicators is now being followed by a sell signal on both Stochastics and MACD lines, whilst the RSI is also on the slide. A corrective outlook is threatening. A close below 1.3640 has opened for further downside with 130 pips of initial downside to 1.3510. This would be confirmed on a breach of 1.3600 which would then open support between 1.3450/1.3535. The hourly chart shows that with hourly momentum negatively configured rallies now look a chance to sell the previous support at 1.3640 is now resistance and is a selling opportunity.
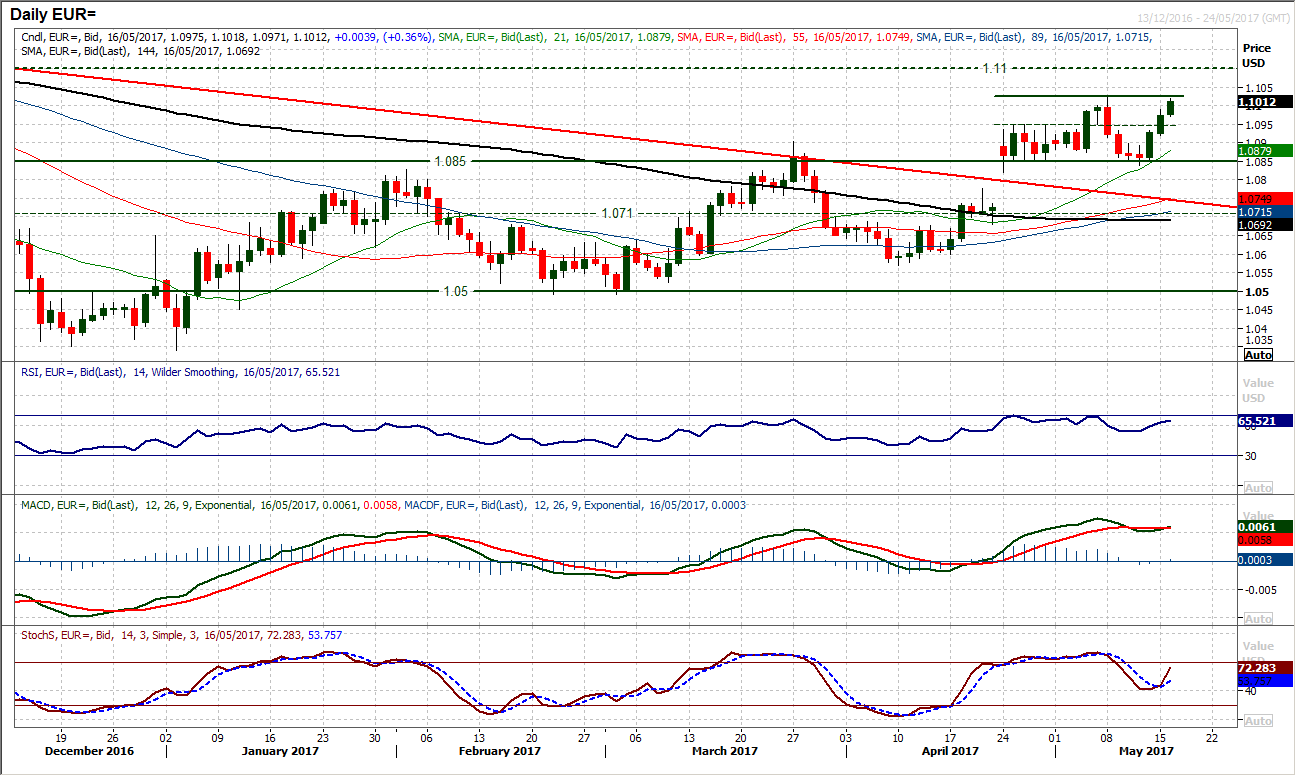
EUR/USD
Having regained control of the consolidation the bulls are now positioning for a potential upside breakout again. The support at $1.0850 has been bolstered as a second straight bull candle has taken the market through the minor resistance at $1.0950 which has now opened the $1.1022 May high. Momentum indicators are turning positive again with the Stochastics crossing back higher yesterday and the MACD lines threatening to do the same. Reaction to the $1.1022 resistance will be interesting. Can the bulls achieve a closing breakout which would then open $1.1100 again? The hourly chart is strongly configured for further gains as consolidation is being bought into. There is initial support at $1.0963 before a consolidation area around $1.0920. With the positive medium to longer term outlook in place on the euro, the market will look to use corrections as a chance to buy.
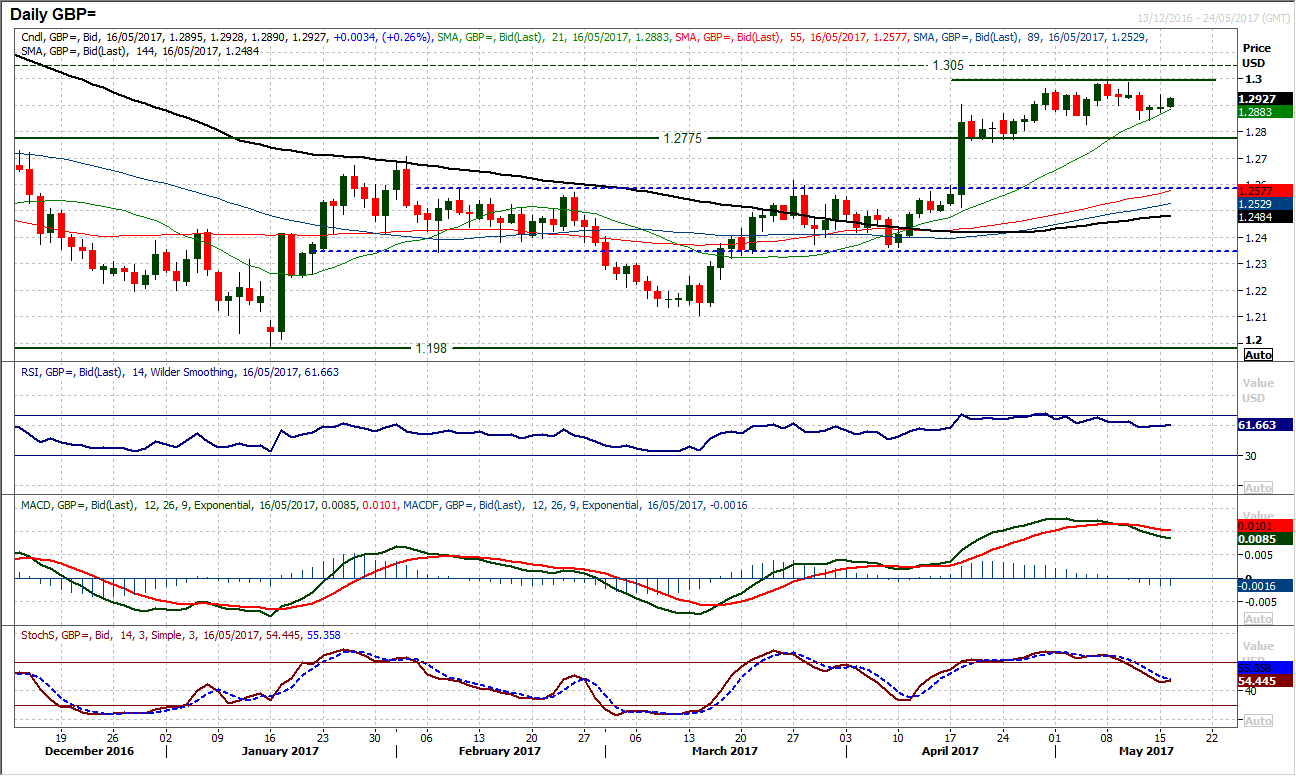
GBP/USD
Sterling has struggled for traction since last Thursday and the Bank of England. A second consecutive small bodied candle reflects an uncertainty and something holding back the buyers. Losing momentum into the close last night was not massively encouraging for the bulls and it looks as though the market is increasingly becoming a range play. The support at $1.2830 has survived the dovish Bank of England however the technicals continue to suggest that the traction has been lost from the push higher. The hourly chart also suggests that the market remains supported but needs a catalyst to generate the bull momentum again. Hourly indicators point towards a neutral, range market, with the resistance at $1.2940/$1.2950 under the key multi month high of $1.2990. Support of the higher low remains at $1.2830 and is being bolstered by $1.2843. The early move is higher today but traders will be taking a steer from the UK inflation data this morning. A high number would be supportive for sterling.
USD/JPY
The market looks to be entering a period of choppy trading that is driving a consolidation. The bull trend higher that has seen the market rally for the past four weeks has been broken however that does not mean that there will now be a retracement move. The support came in yesterday at 113.09 which was around the latest breakout and is the first real basis of support. Holding on to this support is a positive indication that this will continue as a consolidation. The momentum indicators are rolling over and as yet are still fairly positively configured, with the RSI above 60 and MACD lines still rising. The Stochastics crossing lower would be a warning, but for now the market is supported. The key support remains 111.60/112.20. The hourly chart shows momentum is building a range oscillation between 40/60 on RSI which tends to be an indication of consolidation. Initial resistance is yesterday’s high at 113.85.

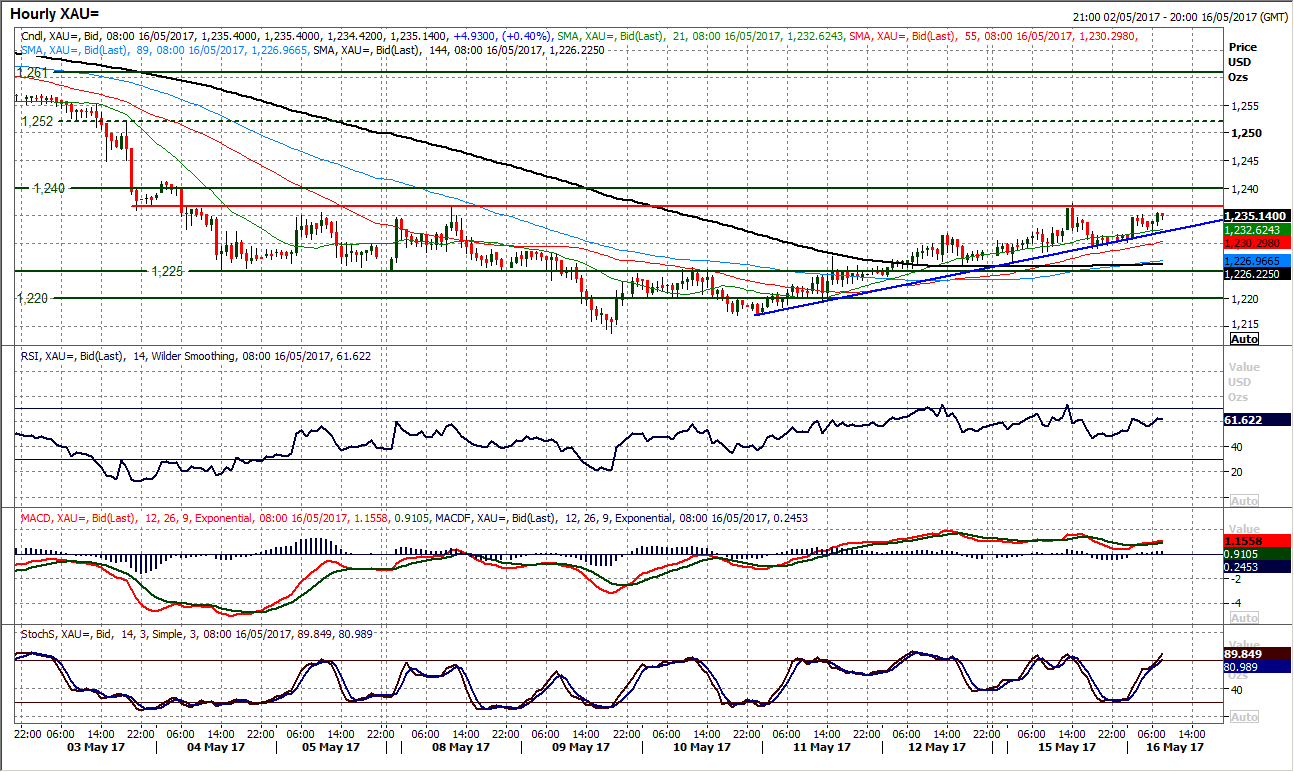
Gold
The gradual rebound continues, however there is still a sense that this remains a bear rally. The downtrend in place since mid-April comes in at $1246 and there are some key levels overhead to come. The bulls had an initial look at the resistance band between $12336/$1240 and shied away yesterday. Although the market closed way off the highs of the session, the bulls continue to make ground with a positive close, whilst today is in similar vein . The momentum indicators are now improving, with the Stochastics close to confirming a bull cross over signal today. Gold looks set to have a significant test of $1240 which is a medium term pivot, and it will be interesting to see how the bulls react. The hourly chart shows positive momentum configuration now with support at $1225 and then $1229.
WTI Oil
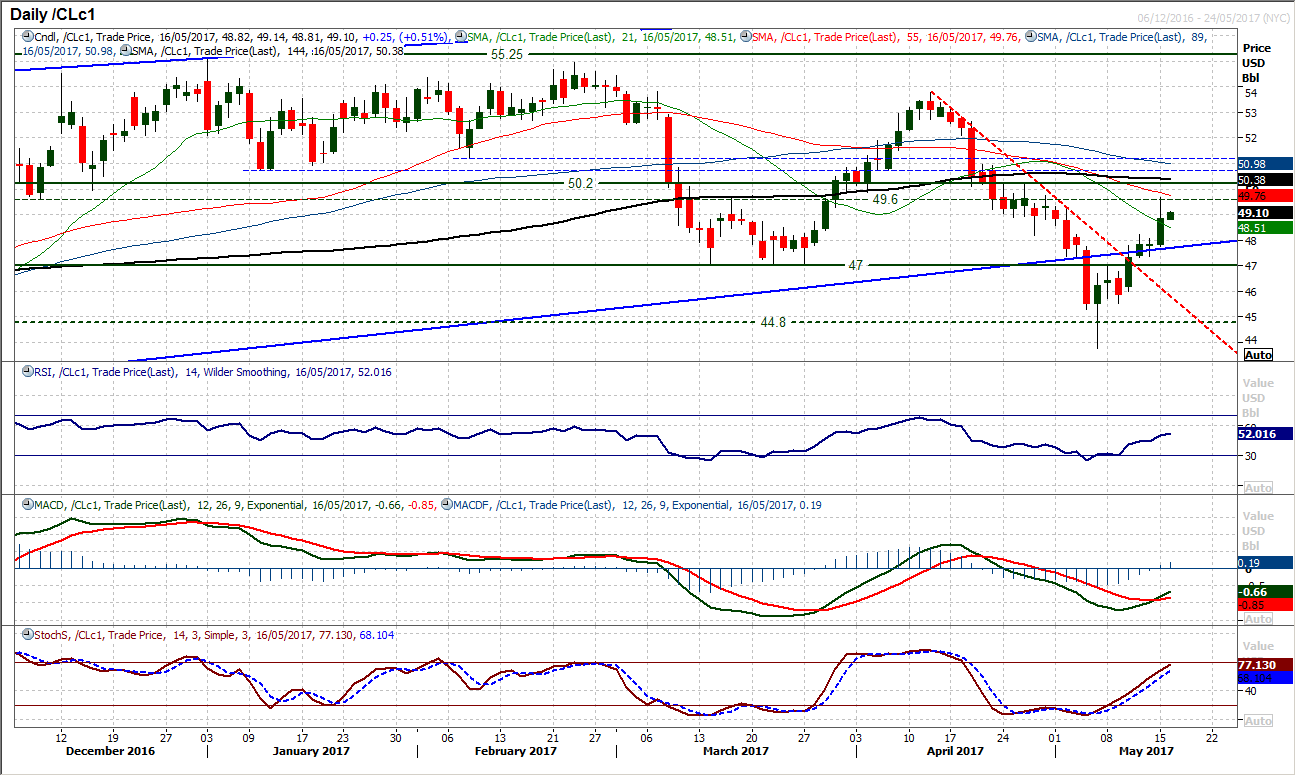
The big rally on oil has continued into the new week with yesterday’s strong bull candle and the technical momentum indicators increasingly positive. The MACD lines have crossed higher, whilst the Stochastics and RSI lines are now both rising above the neutral 50 line. The real test on a medium term basis for the longevity of the rally now comes in with the resistance band $49.60/$50.20 which is a pivotal range over the past 8 months. Yesterday’s high was $49.66 which is adding to the overhead resistance. The hourly chart shows how a there is a support band $47.25/$48.20 to use as a basis of a floor now for the bulls and today’s early moves are once more higher. A closing breakout above $50.20 would suggest that this is more than a bear rally.
Dow Jones Industrial Average
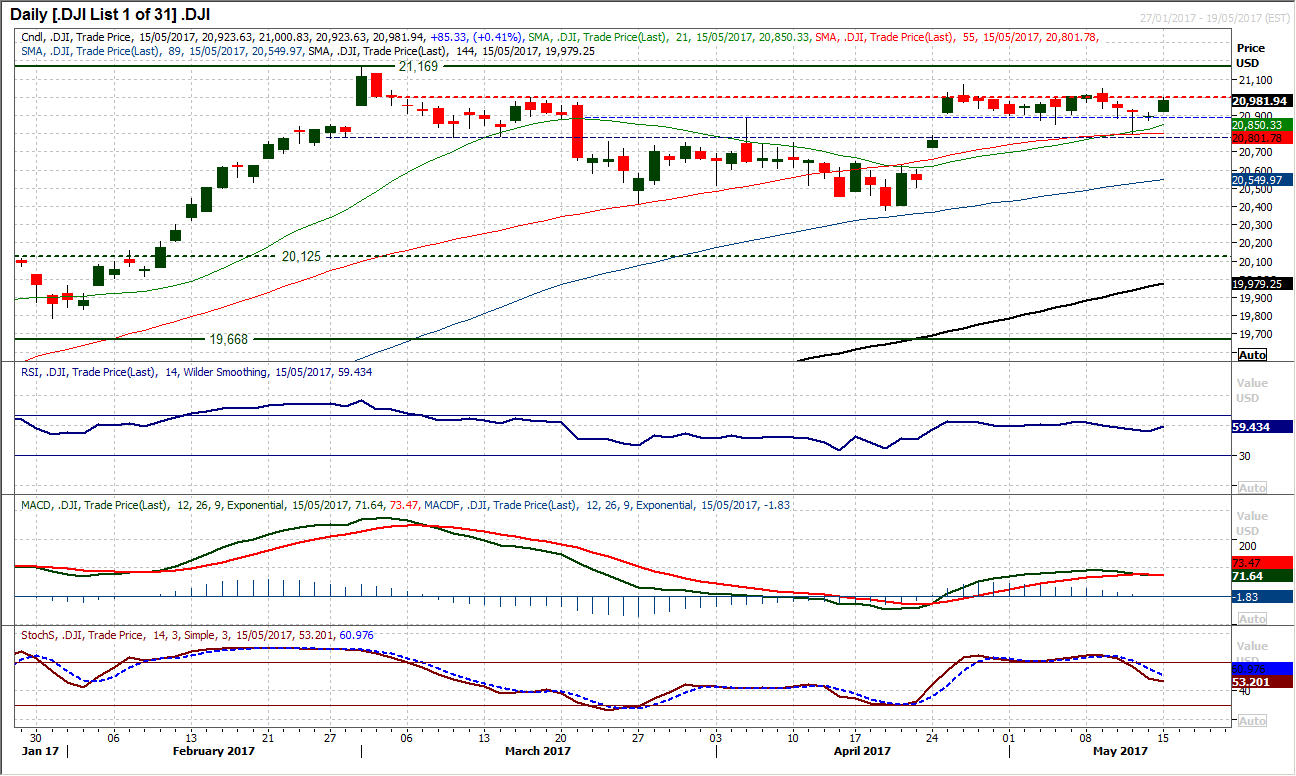
The buying pressure resumed yesterday to prevent a continued deterioration from last week. This has bolstered the support from Thursday’s low at 20,799 and once more the market looks to be in re-iterating the recent trading range. That leaves the Dow with a range 20,799/21,070. Momentum indicators had looked previously to be deteriorating, but with yesterday’s rebound there is a rather more neutral feel to the outlook. The bulls will now be eying the resistance around the top of the range, however the market has tended to struggle above 21,000 in the last couple of weeks. It will be interesting to see if they back away once more. The hourly chart shows a gap is now open at 20,897 from Friday’s close and this will be at risk of being filled at some stage. There is further support at 20,870.
Author

Richard Perry
Independent Analyst


