Dollar Index approaching daily support, EUR/USD upside vulnerable
EUR/USD:
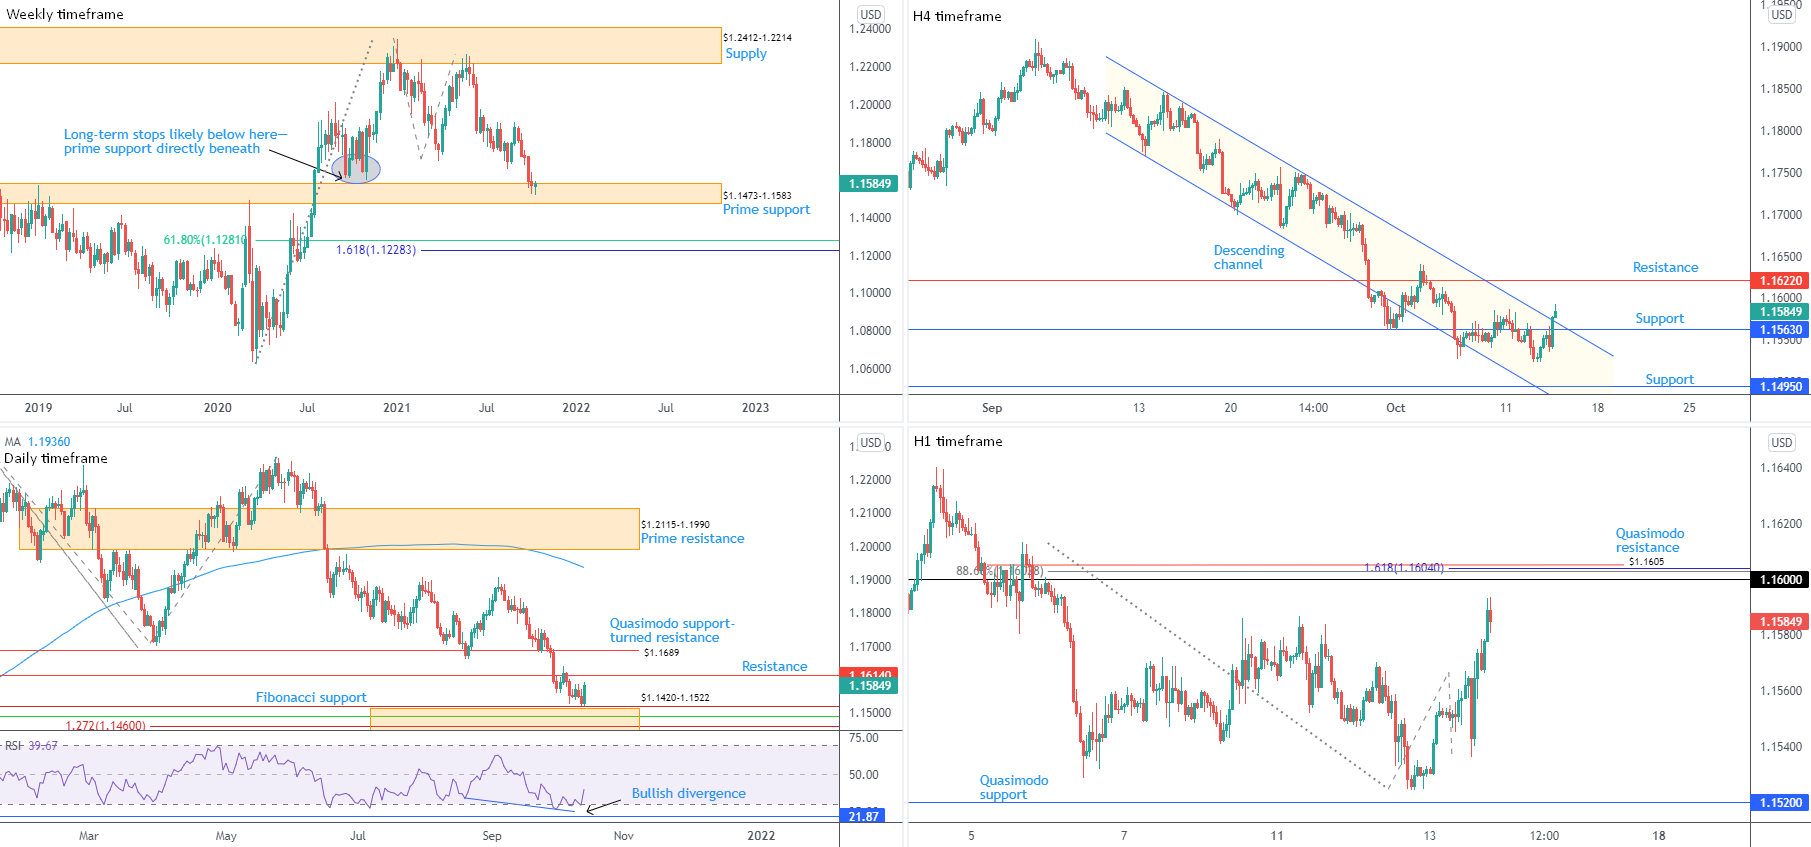
Weekly timeframe:
Recent trading reveals buyers regaining some consciousness out of prime support at $1.1473-1.1583. Follow-through buying is on the table, potentially fuelled on the back of long-term sell-stops tripped beneath lows at $1.1612 (2020).
In the event buyers fail to agree higher prices, south of current support shines the technical spotlight on a 61.8% Fibonacci retracement at $1.1281, organised above a 1.618% Fibonacci projection from $1.1228.
Daily timeframe:
A handful of pips ahead of Fibonacci support between $1.1420 and $1.1522, EUR/USD bulls entered an offensive phase Wednesday, motivated by softer US Treasury yields and a lower dollar. Of technical note is the aforementioned Fibonacci support glued to the lower side of the weekly timeframe’s prime support.
Resistance demands attention at $1.1614, with a break unmasking Quasimodo support-turned resistance at $1.1689.
Out of the relative strength index (RSI), the value recently pulled in hidden divergence from within oversold territory. The 50.00 centreline is now a watched level; movement north of the latter signals positive momentum.
H4 timeframe:
Wednesday’s bullish narrative lifted the currency pair above $1.1563 and, in recent hours, above channel resistance, extended from the high $1.1846. Violating the aforementioned levels centres attention on resistance from $1.1622—fixed a few pips above daily resistance at $1.1614.
Medium-term sentiment facing southbound since June, however, could weigh on further upside. With that, $1.1622 serves as a base sellers might emerge from if brought into the fight.
H1 timeframe:
Refreshing weekly peaks at $1.1593—after rupturing Monday’s session top at $1.1587—draws focus to $1.16. Addressing this psychological level could bring about a whipsaw to neighbouring Quasimodo resistance at $1.1605, plotted together with an 88.6% Fibonacci retracement at $1.1603 and a 1.618% Fibonacci projection from $1.1604.
Traders are also urged to pencil in the possibility of a spike to daily and H4 resistances, seated above the noted H1 resistances at $1.1614 and $1.1622, respectively.
Observed Technical Levels:
Between $1.1622 and $1.16 represents key resistance, taken from daily, H4 and H1 timeframes. Price respecting this area suggests a shortfall of bullish interest out of weekly prime support at $1.1473-1.1583. Overthrowing the said resistance, on the other hand, indicates strength to the upside.
AUD/USD:
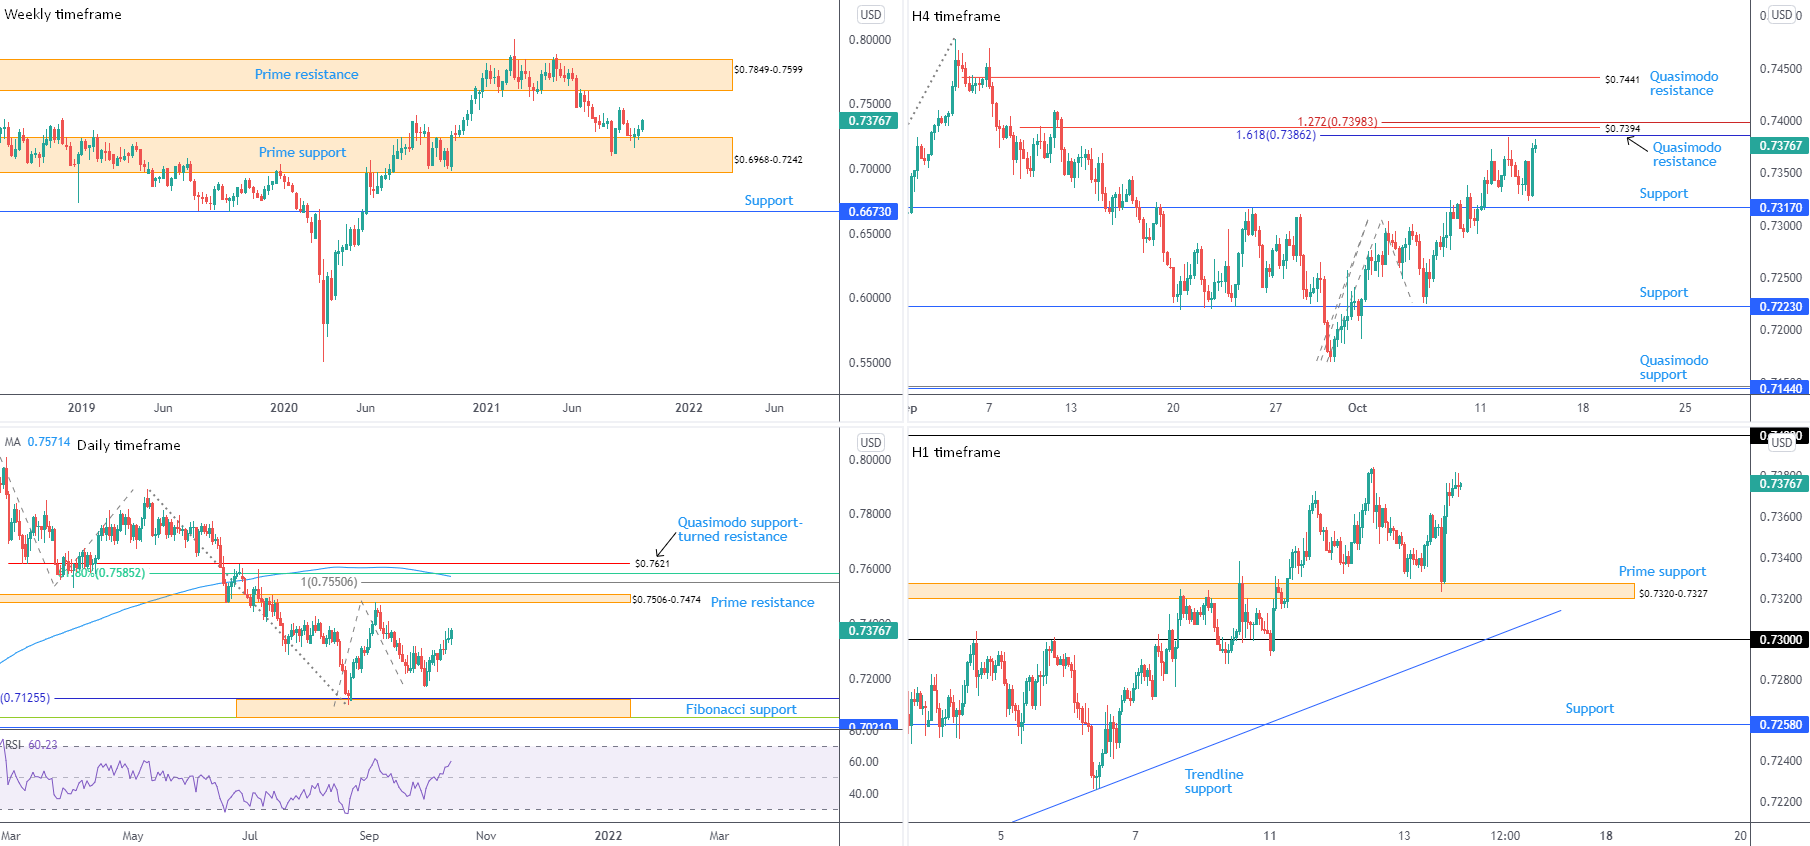
Weekly timeframe:
Buyers are beginning to emerge from prime support at $0.6968-0.7242. Prime resistance at $0.7849-0.7599 is a reasonable target, though failure to preserve gains opens up support at $0.6673.
Trend studies on the weekly scale show we’ve been higher since early 2020. Consequently, the response from $0.6968-0.7242 might be the start of a dip-buying attempt to join the current trend.
Daily timeframe:
The Australian dollar extended its bullish presence Wednesday, closing in on weekly tops at $0.7385.
Decorating the chart with additional upside has prime resistance at $0.7506-0.7474 in sight. Immediately above here, Quasimodo support-turned resistance is at $0.7621, which happens to join closely with the 200-day simple moving average at $0.7571, a 61.8% Fibonacci retracement at $0.7585 and a 100% Fibonacci projection at $0.7551.
Latest out of the relative strength index (RSI) reveals the value journeyed above the 50.00 centreline, informing traders that average gains exceed average losses: momentum to the upside.
H4 timeframe:
Leaving support at $0.7317 unopposed, AUD/USD is zeroing in on Quasimodo resistance at $0.7394 (enclosed within a 1.618% Fibonacci expansion at $0.7386 and a 1.272% Fibonacci projection at $0.7398).
Overthrowing noted resistance shifts focus to Quasimodo resistance parked at $0.7441.
H1 timeframe:
For those who read Wednesday’s technical briefing you may recall the following (italics):
In similar fashion to yesterday’s analysis, we know price on the weekly timeframe is coming from prime support at $0.6968-0.7242, in addition to the daily timeframe exhibiting scope to approach resistance at $0.7506-0.7474.
This, once again, positions H1 support at $0.7339 [since removed] as a base buyers could show from, along with H1 prime support at $0.7320-0.7327—H4 support is visible beneath the aforementioned area at $0.7317.
As evident from the chart, H1 prime support at $0.6968-0.7242 made its way into the spotlight heading into US trading hours, a move enticing healthy bullish force. Overturning weekly tops at $0.7385 brings $0.74 in focus, which resides just above H4 resistances between $0.7398 and $0.7386.
Observed Technical Levels:
Attention is on $0.74 on the H1 scale, and H4 resistance between $0.7398 and $0.7386. However, sellers are likely to seek additional confirmation before committing, as weekly and daily timeframes show an absence of resistance until $0.7506-0.7474 on the daily timeframe.
USD/JPY:
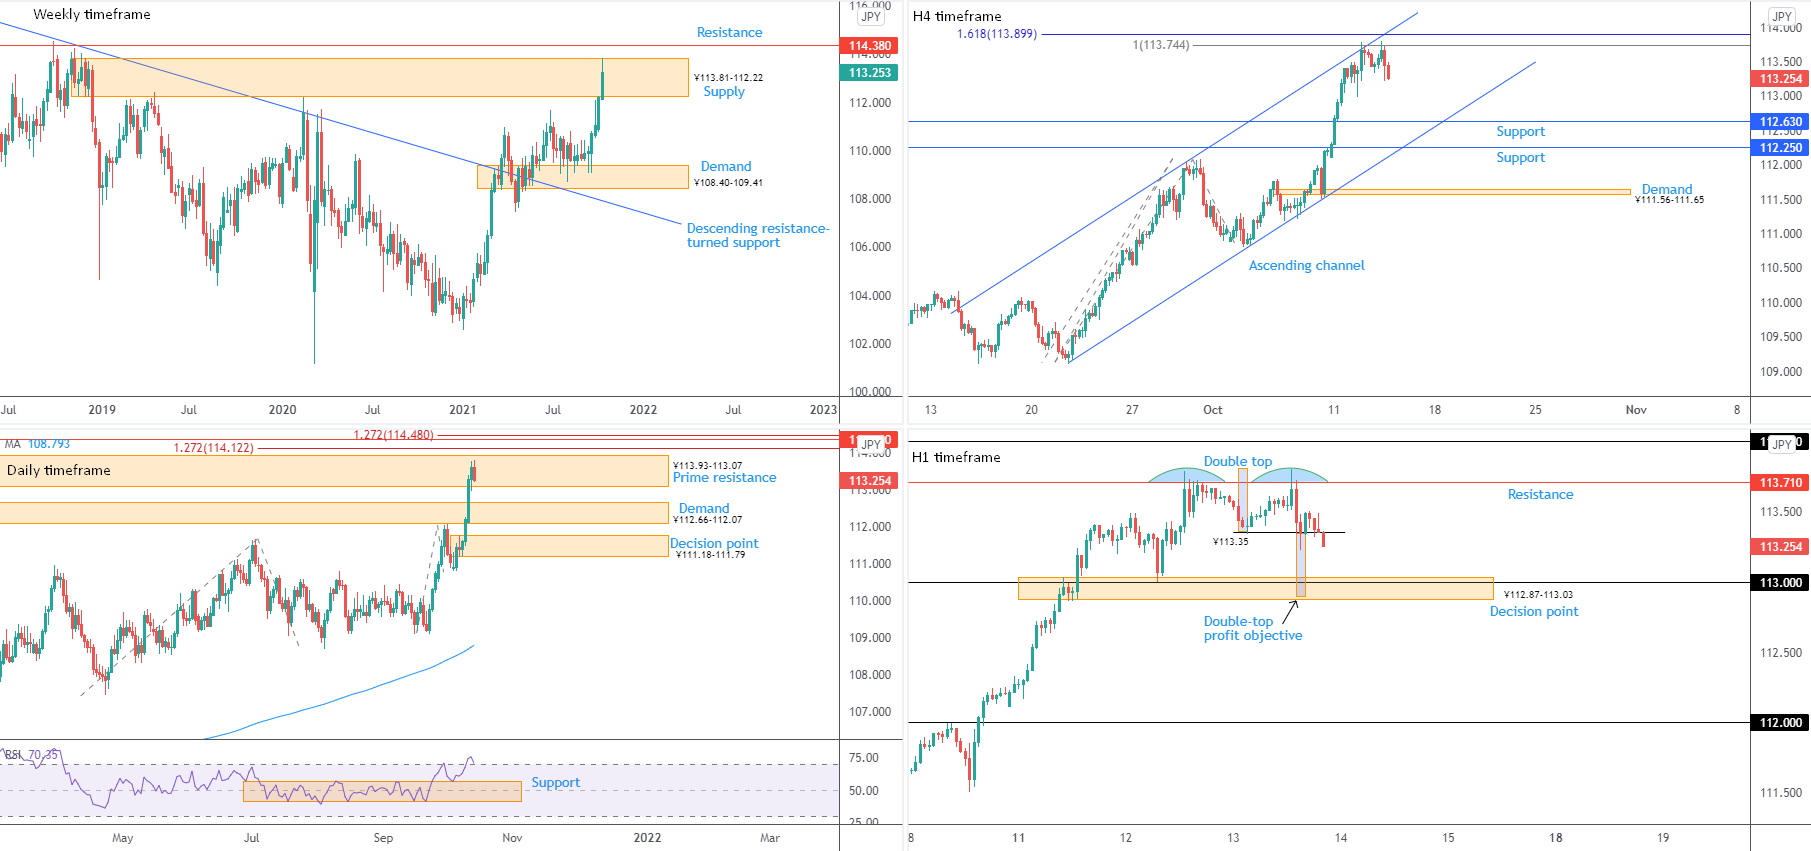
Weekly timeframe:
Supply at ¥113.81-112.22 remains under considerable pressure, with neighbouring resistance arranged at ¥114.38. Clearing the aforementioned supply may raise some eyebrows, in view of the area capping downside since April 2019.
Sellers taking the wheel directs flow to familiar demand at ¥108.40-109.41—arranged north of descending resistance-turned support, taken from the high ¥118.61.
In terms of the immediate trend, we’ve been advancing since the beginning of this year.
Daily timeframe:
The Japanese yen welcomed some demand on Wednesday, lifted on rising bond prices and a broadly soft USD. Fading fresh 2021 peaks at ¥113.81, USD/JPY bears are seen making an entrance within the walls of prime resistance at ¥113.93-113.07, an area clipped to the upper boundary of weekly supply.
Area above current supply shows weekly resistance from ¥114.38 working with two 1.272% Fibonacci projections on the daily scale at ¥114.12 and ¥114.48.
From the relative strength index (RSI), following support emerging from 56.85 early last week, the indicator’s value is exploring overbought space. However, with the trend facing northbound this year, overbought signals should be viewed in this context.
H4 timeframe:
For those who read Wednesday’s technical briefing you may recall the following points (italics):
Recognising active weekly and daily supply zones, H4 activity is shaking hands with channel resistance, extended from the high ¥112.05, as well as a 100% Fibonacci projection at ¥113.74 and a 1.618% Fibonacci expansion at ¥113.90.
A retracement from the aforesaid resistances, shines the spotlight on support at ¥112.63, dovetailing closely with channel support, drawn from the low ¥109.12.
As you can see, sellers did indeed make a show from channel resistance, which, as underlined above, could have the currency pair make its way to support at ¥112.63.
H1 timeframe:
Recent downside pressure from resistance at ¥113.71 generated a double-top formation at ¥113.79, drawn with a neckline from ¥113.35 that was recently breached. The pattern’s profit objective—measured by taking the distance between the highest peak within the configuration and the neckline and extending this value from the breakout point—sits within the decision point at ¥112.87-113.03, an area also encasing the psychological level ¥113.
Observed Technical Levels:
Knowing we have active weekly and daily supply, together with H4 reacting from channel resistance, extended from the high ¥112.05 and H1 recently puncturing a double-top pattern’s neckline at ¥113.35, USD/JPY could drop in on the H1 decision point at ¥112.87-113.03.
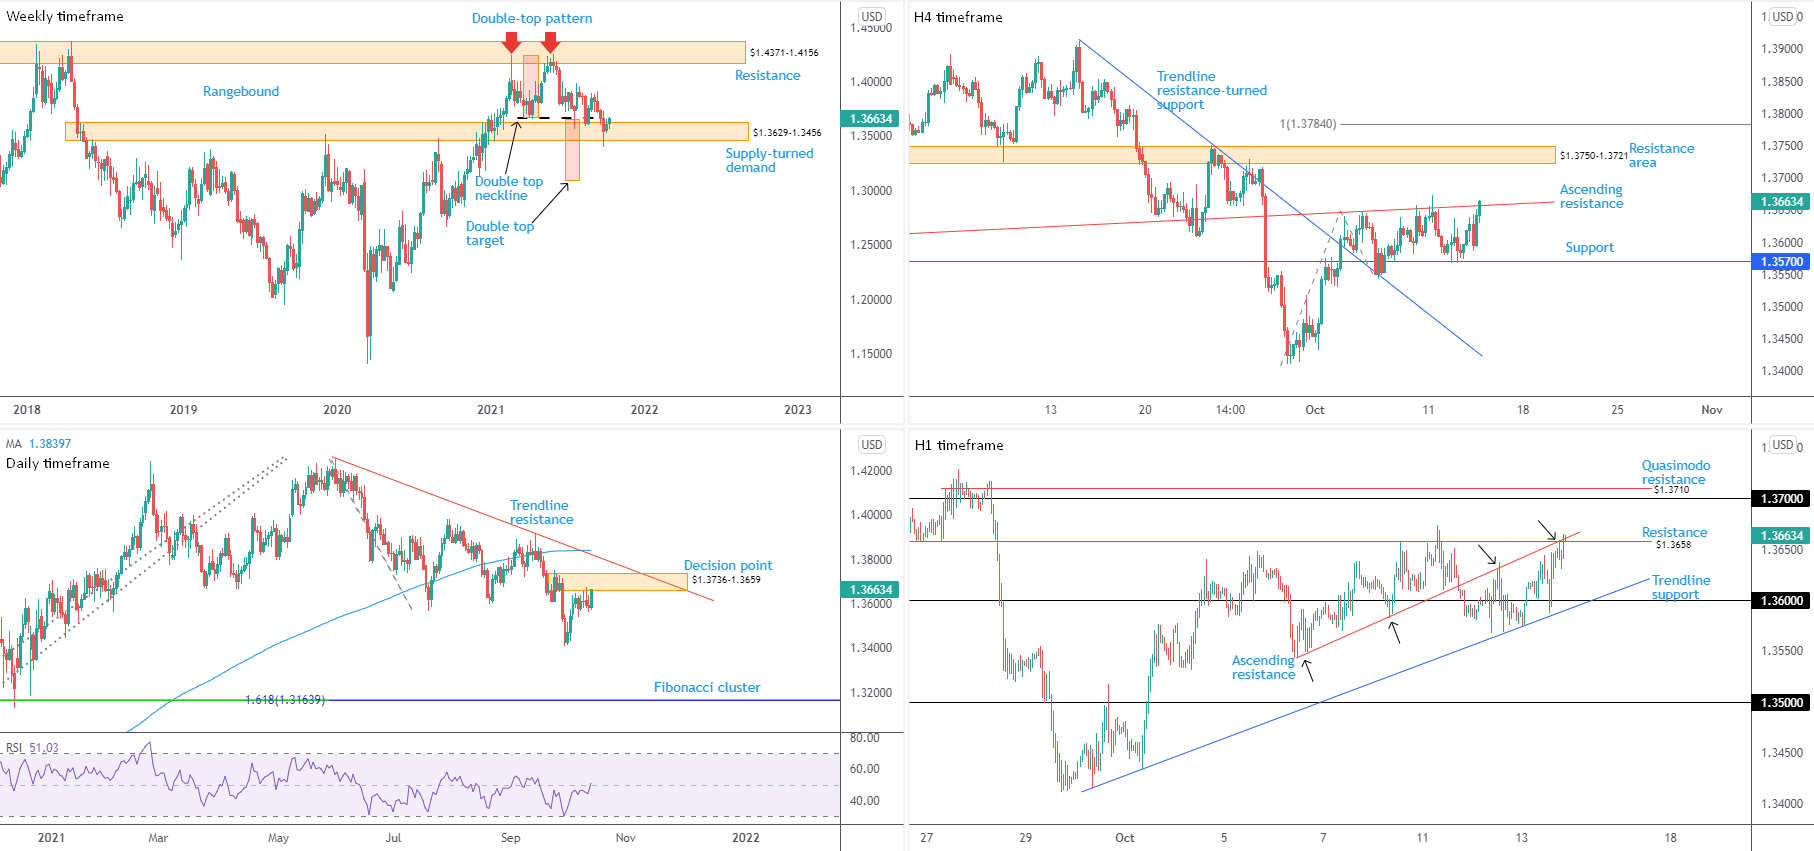
GBP/USD:
Weekly timeframe:
Supply-turned demand at $1.3629-1.3456 continues to emphasise a distressed atmosphere after having its lower limits clipped at the end of September. In spite of the recent recovery, it’s important to note price also closed below a double-top pattern’s ($1.4241) neckline at $1.3669, signalling bears are looking to take charge.
The double-top pattern’s profit objective—measured by taking the distance between the highest peak to the neckline and extending this value lower from the breakout point—sits around $1.3093. Conservative pattern sellers are likely to pursue a candle close beneath $1.3629-1.3456 before pulling the trigger.
Daily timeframe:
The $1.3736-1.3659 decision point remains an important area in this market. Respecting the aforementioned decision point helps confirm bearish intent within the weekly timeframe’s supply-turned demand at $1.3629-1.3456, and reinforces the idea of a successful double-top pattern.
Trendline resistance, taken from the high $1.4250, and the 200-day simple moving average at $1.3840 are seen above the current decision point; below is the $1.3412 low (29th September), with subsequent selling highlighting a Fibonacci cluster (support) around $1.3164.
From the relative strength index (RSI), the indicator’s value is attempting to voyage above the 50.00 centreline. Clearing the latter informs market participants momentum is to the upside: average gains exceed average losses.
H4 timeframe:
Support from $1.3570 is proving troublesome to overcome on the H4 scale, directing flow to an ascending resistance, projected from the low $1.3572. Seizing the said level guides resistance at $1.3750-1.3721 into the light, along with a nearby 100% Fibonacci projection at $1.3784.
H1 timeframe:
US hours on Wednesday witnessed price whipsaw through ‘London’ lows at $1.3602 and test the mettle of $1.36. Albeit extending to a low of $1.3588, GBP/USD bulls subsequently demonstrated healthy interest to the upside, which, in recent action, led price to resistance at $1.3658 and an ascending resistance, drawn from the low $1.3544.
Clearance of $1.3658 exposes $1.37 and Quasimodo resistance tucked 10 pips above at $1.3710.
Observed Technical Levels:
The daily timeframe’s decision point at $1.3736-1.3659, uniting with H1 resistance at $1.3658 and ascending resistances on the H1 and H4, delivers robust resistance to work with.
Alternatively, splitting current H4 and H1 resistances may draw in bearish curiosity from $1.37 and Quasimodo resistance at $1.3710 on the H1, both of which are within the noted daily decision point.
Author

Aaron Hill
FP Markets
After completing his Bachelor’s degree in English and Creative Writing in the UK, and subsequently spending a handful of years teaching English as a foreign language teacher around Asia, Aaron was introduced to financial trading,


