Dollar bolsters due to PMI readings

The latest U.S. Job Opening data, dropping to its lowest level since March 2021 at 8.73 million, offers a preliminary insight ahead of the crucial Non-Farm Payrolls (NFP) report scheduled for Friday. Despite this downbeat job data, the U.S. dollar found support from better-than-expected PMI readings, indicating a resilient U.S. economy. However, the softening job data failed to catalyse upward movement in U.S. equity markets, which have been lingering near recent peaks. In the cryptocurrency realm, Bitcoin (BTC) continues to build on its upward momentum, fueled by optimism surrounding the potential approval of a Spot BTC Exchange Traded Fund (ETF) by the U.S. Securities and Exchange Commission (SEC). Bitcoin, the most valuable cryptocurrency, has surged by over 160% this year.
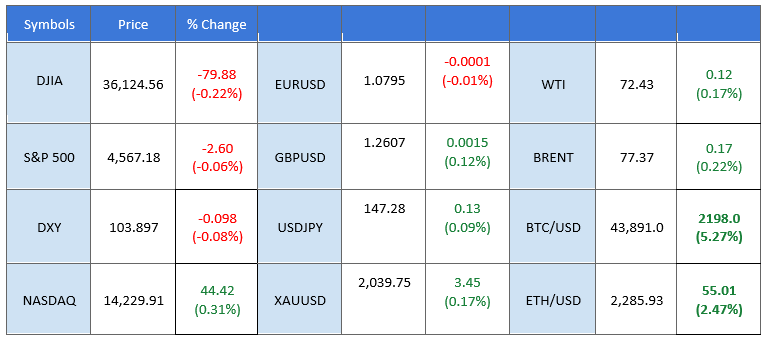
Market overview
Prices as of 03:00 EET
Economic calendar
(MT4 system time)
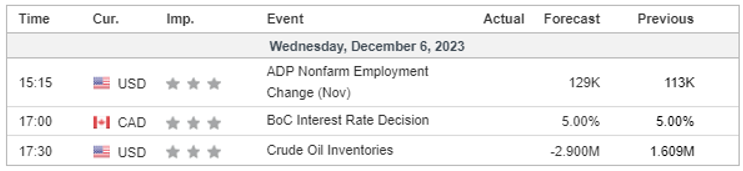
Source: MQL5
Market movements
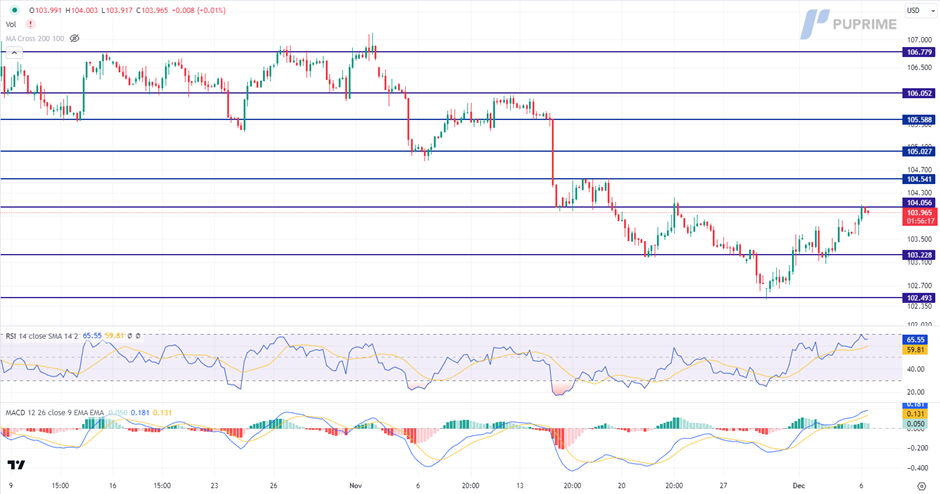
Dollar Index, H4
The US Dollar strengthens, reaching a two-month high, fueled by conflicting economic data that paints a varied picture of the nation's economic health. With JOLTS Job Openings signalling a cooling job market and ISM Services PMI exceeding expectations, investors navigate through uncertainty, closely watching indicators like Nonfarm Payrolls and the US Unemployment Rate for clearer market insights.
The Dollar Index is trading higher while currently testing the resistance level. However, MACD has illustrated diminishing bullish momentum, while RSI is at 65, suggesting the index might experience technical correction since the RSI had entered overbought territory.
Resistance level: 104.05, 104.55.
Support level: 103.25, 102.50.
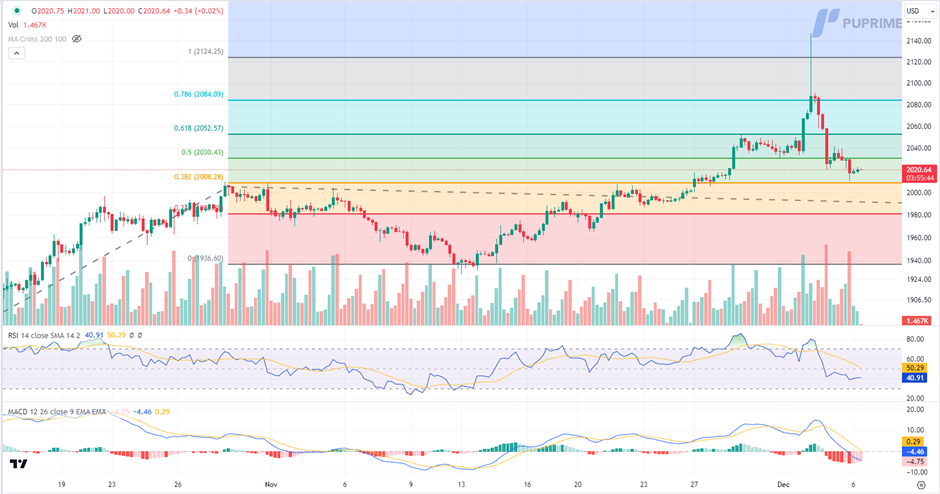
XAU/USD, H4
Gold prices hover around the support level of 2020, caught in a consolidation phase influenced by the recent rebound of the US Dollar. Economic optimism, fueled by better-than-expected data, complicates the outlook for the precious metal. Investors keenly await US jobs data, particularly Nonfarm Payroll and Unemployment Rate releases, for clarity on gold's trajectory.
Gold prices are trading lower while currently testing the support level. MACD has illustrated increasing bearish momentum, while RSI is at 41, suggesting the commodity might extend its losses after breakout since the RSI stays below the midline.
Resistance level: 2030.00, 2050.00.
Support level: 2010.00, 1980.00.
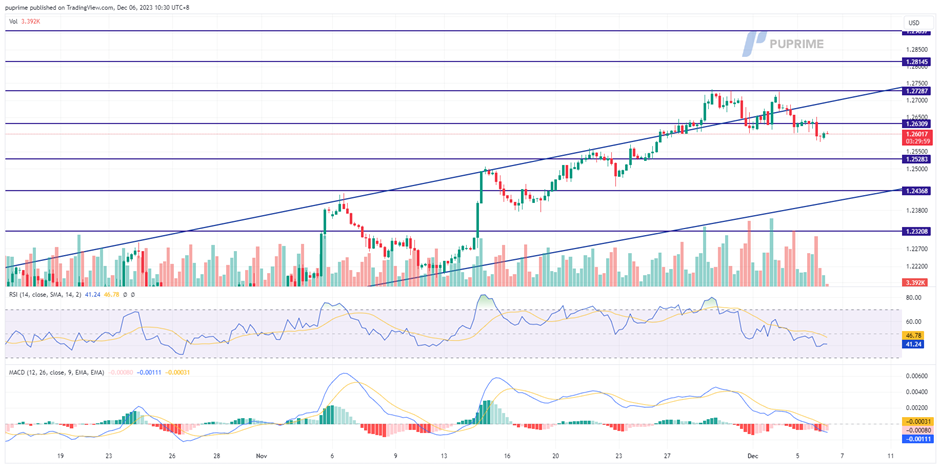
GBP/USD, H4
The British Pound, represented by the Cable, has demonstrated resilient strength in the face of increasing downside pressure, particularly with the recent gains in the U.S. dollar. The U.S. dollar has strengthened despite a downbeat job market, highlighted by the U.S. job opening data dropping to its lowest level since March 2021. This trend is further supported by better-than-expected U.S. Purchasing Managers' Index (PMI) readings, signalling the robustness of the U.S. economy. Market attention is now focused on Friday's Non-Farm Payrolls (NFP) report, expected to provide insights into the Federal Reserve's prospective monetary policy moves.
The Cable has broken below the uptrend reference line, suggesting the Cable might get into a bearish trend. The RSI is approaching the oversold zone while the MACD has broken below the zero line, suggesting that the bearish momentum is forming.
Resistance level: 1.2631 1.2729.
Support level: 1.2528, 1.2437.
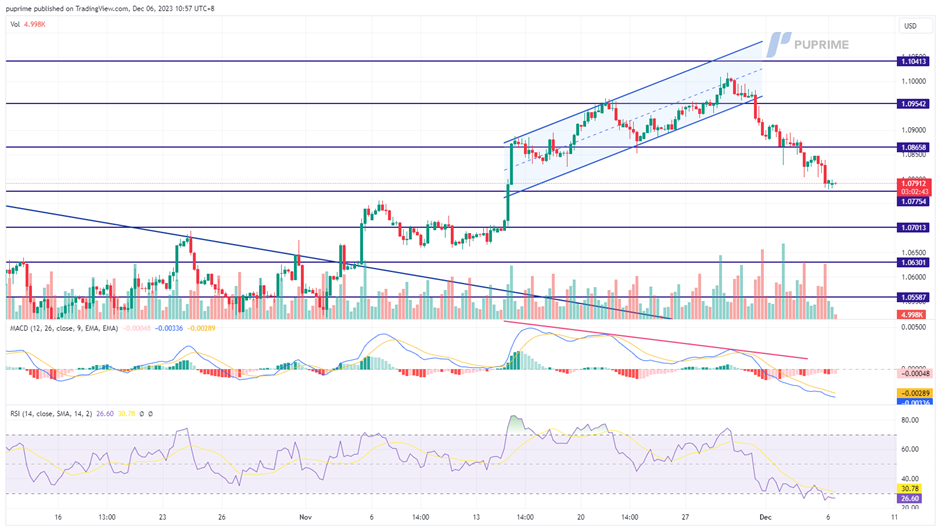
EUR/USD, H4
The EUR/USD pair extends its downward trajectory, marking the fifth consecutive day of decline, propelled by the ongoing strengthening of the U.S. dollar. The dollar, rebounding from its recent low, is fortified by positive Purchasing Managers' Index (PMI) readings. Euro traders are closely monitoring the upcoming eurozone's GDP data scheduled for Thursday, seeking insights into the euro's strength and hoping for a potential technical rebound in the currency pair.
The EUR/USD pair is trading in a strong bearish momentum and declining in 5 straight sessions. The MACD continuing to slide while the RSI breaks into the oversold zone suggests that the bearish momentum is strong.
Resistance level: 1.0866, 1.0954.
Support level: 1.0775, 1.0700.
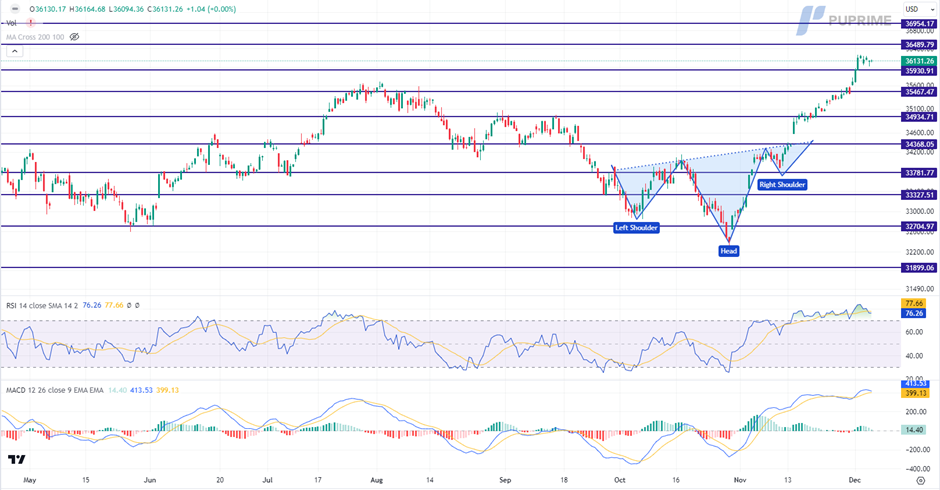
Dow Jones, H4
Following a substantial surge, the US equity market experiences a temporary hiatus as a dearth of significant market catalysts sets the brakes on recent momentum. Despite this pause, the overall trend remains fundamentally bullish, propelled by the descent of US Treasury yields and anticipations of dovish signals from the Federal Reserve. Investors, widely anticipating the Fed's decision, foresee a maintenance of current interest rates at the upcoming meeting, fostering stability in the equity market.
The Dow is trading higher following the prior breakout above the previous resistance level. However, MACD has illustrated diminishing bullish momentum, while RSI is at 76, suggesting the index might enter overbought territory.
Resistance level: 36490.00, 36955.00.
Support level: 35930.00, 35465.00.
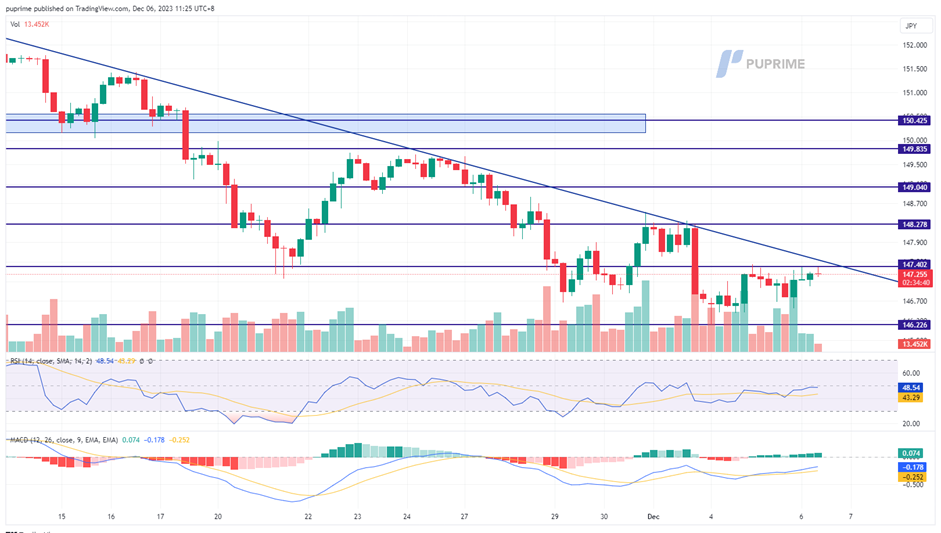
USD/JPY, H4
The USD/JPY pair has found support around the 146.65 level, signalling an attempt at a potential trend reversal. The strength of the Japanese Yen has been subdued by the recent downbeat Japan Core CPI released on Tuesday, while the U.S. dollar has seen some strengthening amidst mixed economic data. The upcoming Friday's Non-Farm Payrolls (NFP) release is anticipated to be a pivotal point for the USD/JPY pair, influencing its direction in the market.
The USD/JPY has eased from its bearish trend and is attempting to break above its near-resistance level at 147.40. The RSI remain flowing at below 50-level while the MACD has a higher high formation, suggesting a trend reversal may happen.
Resistance level: 147.40, 148.30.
Support level: 146.23, 144.78.
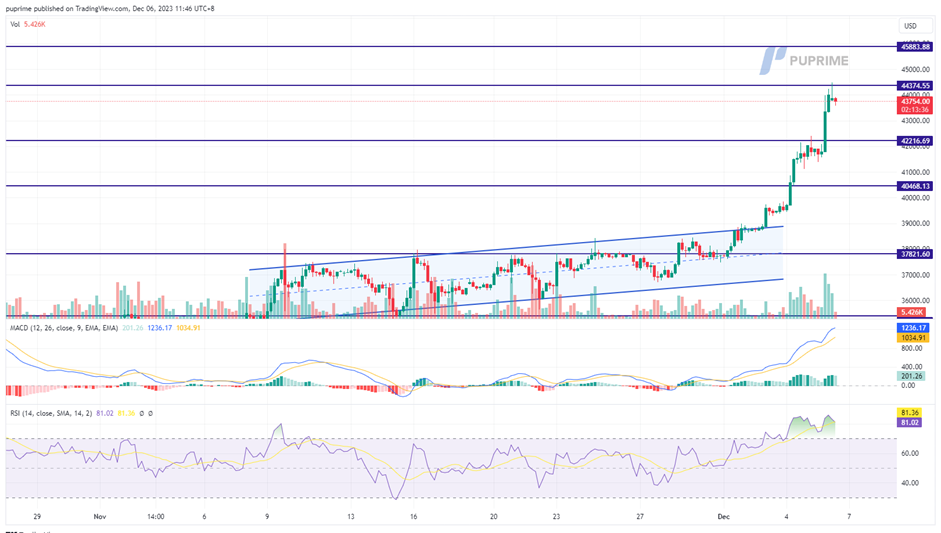
BTC/USD, H4
BTC prices have sustained their surge, reaching the $44,000 level, a milestone not seen since April 2022. The Crypto Fear and Greed Index consistently staying above 70 signals a prevailing high-risk appetite in the crypto market. Concurrently, the fear of missing out (FOMO) sentiment remains palpable, contributing to the ongoing momentum for BTC as it continues its upward climb over the week. The combination of sustained market optimism and FOMO dynamics underscores the robust sentiment driving the cryptocurrency's recent performance.
BTC prices are on the brink of breaking another psychological resistance level at $45000 while the bullish momentum remains strong. The RSI has been hovering in the overbought zone while the MACD continues to climb and is diverging, suggesting the bullish momentum remains resilient.
Resistance level: 44370, 45880.
Support level: 42200, 40460.
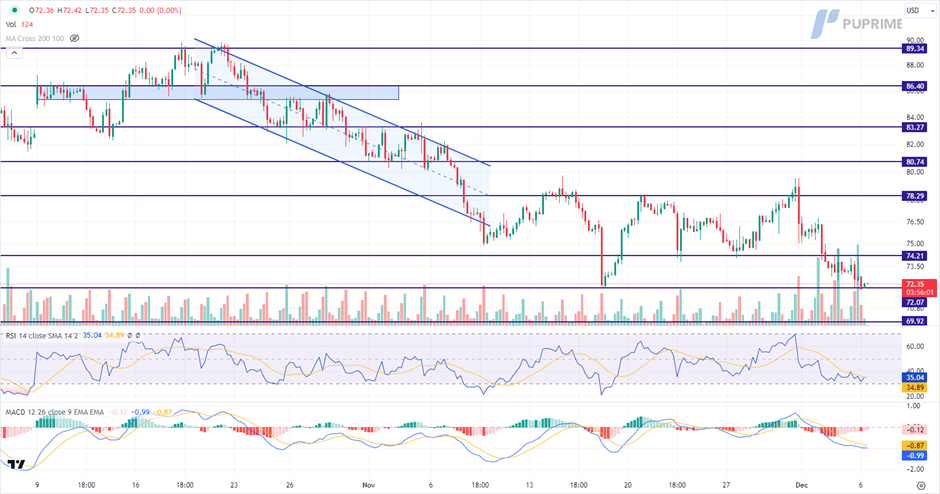
CL Oil, H4
Aggressive losses in crude oil prices persist as fears about the global economic outlook outweigh the impact of OPEC+ output cuts. The unexpected surge in US Crude Oil Inventories and Moody’s negative credit rating for China contribute to heightened economic uncertainties, clouding the horizon for the major oil market player.
Oil prices are trading lower while currently testing the support level. However, MACD has illustrated diminishing bearish momentum, while RSI is at 35, suggesting the commodity might enter oversold territory.
Resistance level: 74.20, 78.30.
Support level: 72.05, 69.90.
Author

PU Prime team
PU Prime
PU Prime is an award-winning CFD broker offering clients access to multiple products across multiple asset classes. Traders will have access to FX, Commodities, Indices, Share CFDs and Bonds.


