|

Disney (NYSE: DIS) Impulsive Structure is Supporting Further Rally

Disney (NYSE: DIS) surged to new all time highs in April 2019 confirming the breakout of the consolidation range that lasted for 3 years.

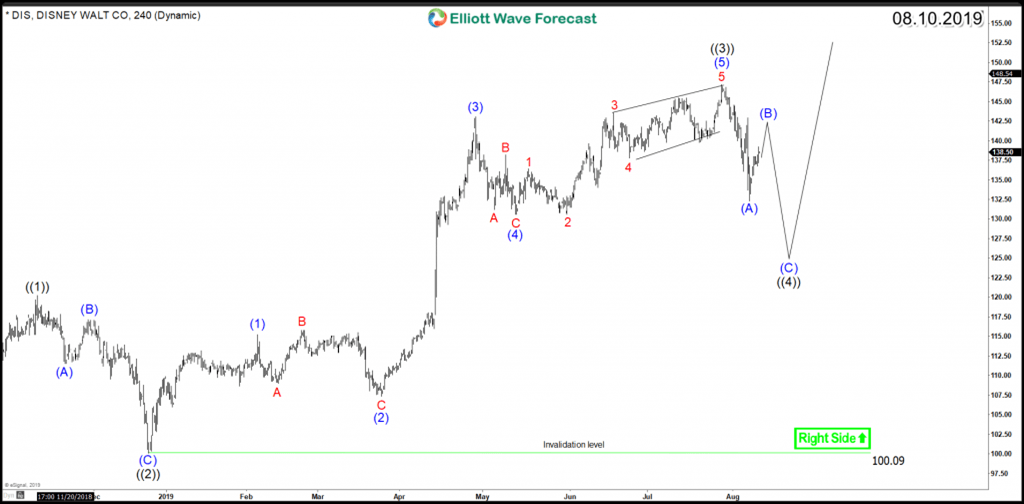
The rally from December 2018 low unfolded as an impulsive 5 waves structure which is part of the weekly cycle from 2016 low. The cycle ended on July peak from where a correction lower has started looking ideally for a 3 waves zigzag structure which can take the stock toward $129 – $123 area before the stock either resume the rally higher or bounce in 3 waves at least.

Disney DIS 4H Chart 08.10.2019

disney


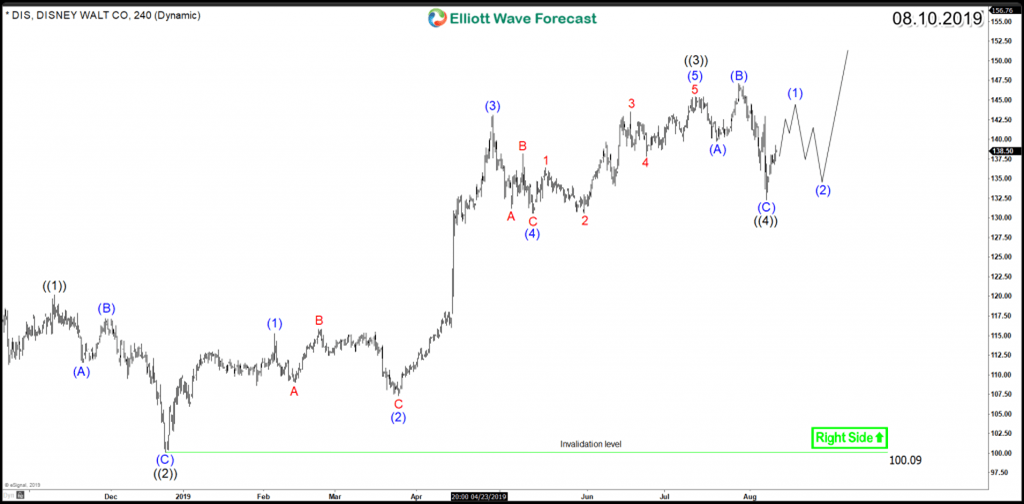
However, if DIS manage to rally higher without doing another leg lower, then the correction could have ended as a 3 waves flat structure so in that case the stock will remain supported above August low and it would aim for a move higher toward $150 – $156 area .

Disney DIS 4H Chart ( Aggressive View) 08.10.2019

disney

In conclusion, Disney has bullish impulsive structure supporting the stock to find buyers in 3 or 7 swings pullback against December 2018 low $100 and it will be looking to make new all time highs after ending the current 4H correction.

Author

Elliott Wave Forecast Team

Elliott Wave Forecast Team

ElliottWave-Forecast.com

More from Elliott Wave Forecast Team
Share:

Editor's Picks

EUR/USD bounces off lows, back to 1.1860

EUR/USD now manages to regain some balance, retesting the 1.1860-1.1870 band after bottoming out near 1.1830 following the US NFP data on Wednesday. The pair, in the meantime, remains on the defensive amid fresh upside traction surrounding the US Dollar.

GBP/USD rebounds to 1.3660, USD loses momentum

GBP/USD trades with decent gains in the 1.3660 region, regaining composure following the post-NFP knee-jerk toward the 1.3600 zone on Wednesday. Cable, in the meantime, should now shift its attention to key UK data due on Thursday, including preliminary GDP gauges.

Gold stays bid, still below $5,100

Gold keeps the bid tone well in place on Wednesday, retargeting the $5,100 zone per troy ounce on the back of humble gains in the US Dollar and firm US Treasury yields across the curve. Moving forward, the yellow metal’s next test will come from the release of US CPI figures on Friday.

Ripple Price Forecast: XRP sell-side pressure intensifies despite surge in addresses transacting on-chain 

Ripple (XRP) is edging lower around $1.36 at the time of writing on Wednesday, weighed down by low retail interest and macroeconomic uncertainty, which is accelerating risk-off sentiment.

US jobs data surprises to the upside, boosts stocks but pushes back Fed rate cut expectations

This was an unusual payrolls report for two reasons. Firstly, because it was released on  Wednesday, and secondly, because it included the 2025 revisions alongside the January NFP figure.

XRP sell-off deepens amid weak retail interest, risk-off sentiment

Ripple (XRP) is edging lower around $1.36 at the time of writing on Wednesday, weighed down by low retail interest and macroeconomic uncertainty, which is accelerating risk-off sentiment.