Decoding the GBP: Commercial trader sentiment and forex price action

Are commercial traders signaling a sustained rally for the British Pound? Understanding the positioning of “smart money” can offer valuable insights into potential currency movements. In this analysis, we’ll dissect two key charts – the British Pound Commercial Long/Short Ratio (CFTC) and the GBP/USD Forex chart – to identify potential trading implications. By combining technical analysis principles with the information presented in these charts, we aim to provide a comprehensive outlook for the GBP.
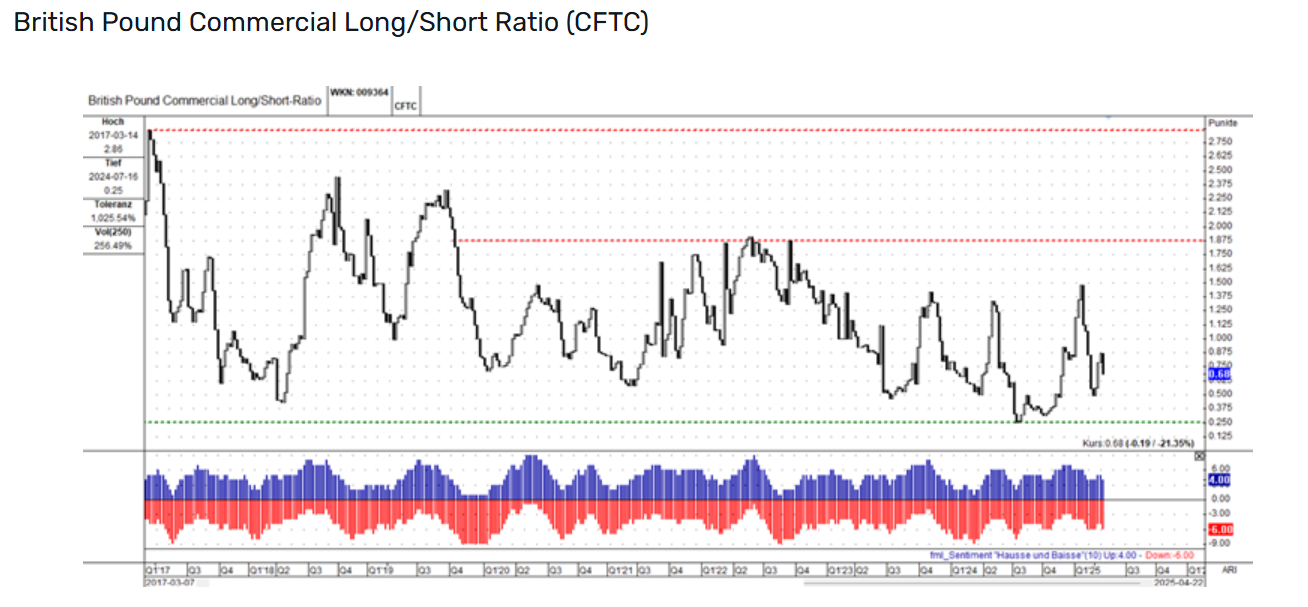
This chart, reported by the Commodity Futures Trading Commission (CFTC), reveals the net positioning of commercial traders (often considered the “smart money”) in the GBP futures market. A high ratio indicates a net long position (bullish sentiment), while a low ratio suggests a net short position (bearish sentiment). Monitoring this data can provide a leading indicator of potential shifts in market sentiment.
- Long-Term Downtrend: The chart reveals a distinct long-term downtrend in the Commercial Long/Short Ratio since early 2017, starting from a high near 2.86. This indicates that commercial traders have generally been reducing their net long positions or increasing their net short positions in GBP futures over the years, suggesting a persistent bearish sentiment towards the GBP over this extended period.
- Key Resistance and Support Levels: The red lines on the chart act as potential resistance levels, areas where the ratio has struggled to consistently break above during its downtrend, suggesting strong selling pressure from commercial traders. Conversely, the green line represents a potential support level. Recent price action shows the ratio bouncing off this level, indicating possible buying interest or a decrease in selling pressure from commercials at this point. The recent upward movement after bouncing off the green support line could signal a potential shift in sentiment towards the GBP, with commercial traders possibly reducing shorts or adding longs. However, it is crucial to observe if this upward movement can be sustained and if the ratio can break above the resistance levels.
- Sentiment Indicator: The sentiment indicator at the bottom shows oscillations between bullish (blue) and bearish (red) momentum. Recently, a shift from predominantly red (bearish) to more blue (bullish) bars aligns with the upward movement in the ratio, reinforcing the idea of a potential shift in sentiment. The decreased magnitude of recent sentiment swings might suggest consolidation or reduced conviction among commercial traders.
GBP/USD forex
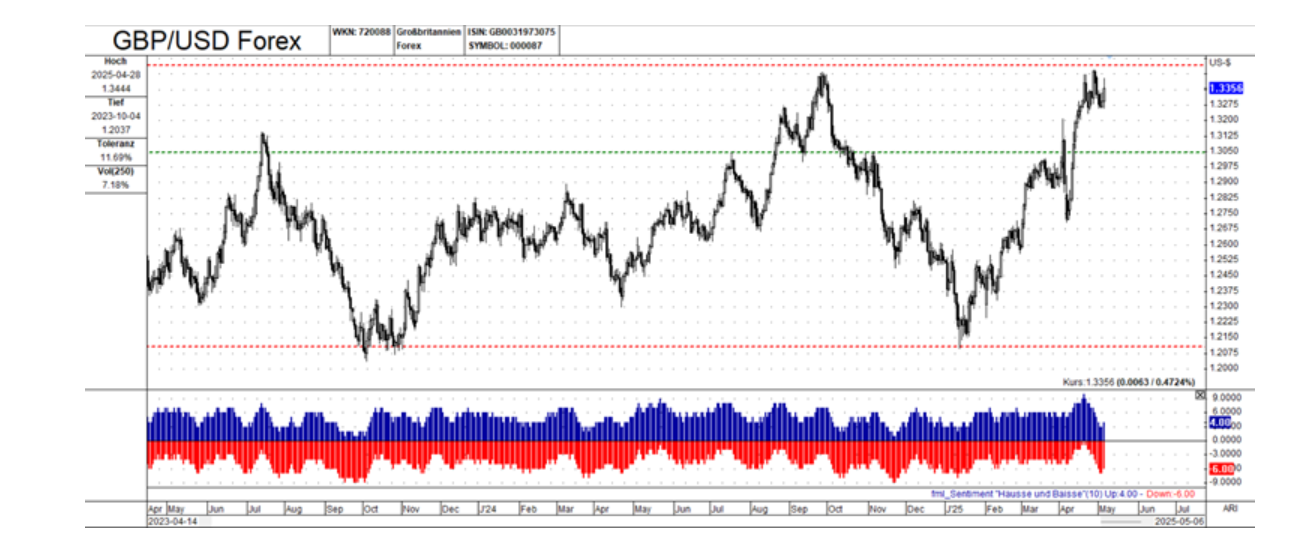
This chart shows the historical price movement of the British Pound against the US Dollar (GBP/USD). Analyzing price action and key levels can help identify potential trading opportunities.
- Recent Price Action: The chart shows a clear downtrend from around April 2022 to October 2022, followed by a strong uptrend that has brought the price to recent highs. This indicates a shift from bearish to bullish momentum in the GBP/USD pair.
- Key Resistance and Support Levels: The upper red line is acting as a potential resistance level, currently being tested by the price. A break above this level could signal further bullish momentum. The lower red line acted as a support level during the downtrend and might become a level to watch for potential pullbacks if the uptrend continues.
- Bullish Momentum and Sentiment: The GBP/USD has been in a strong uptrend, reaching a recent high of 1.3355, suggesting dominant buying pressure. The sentiment indicator at the bottom reflects this price action, showing a shift from predominantly red (bearish) during the downtrend to predominantly blue (bullish) during the uptrend. The strong intensity of the bullish sentiment (height of the blue bars) supports the uptrend.
Connecting the charts: Intermarket analysis
The most insightful analysis arises from comparing and contrasting these two charts:
- Divergence in Early Trend: The Commercial Long/Short Ratio showed a long-term downtrend starting in 2017, while the GBP/USD chart only captures the more recent downtrend from April 2022 onward. This suggests that commercial traders had been bearish on the GBP for a longer period than reflected in the shorter-term GBP/USD price action.
- Recent Convergence: Both charts now show a potential shift towards bullishness. The Long/Short Ratio has bounced off a support level and is trending upwards, and the GBP/USD is in a strong uptrend. This convergence suggests a potential alignment of commercial trader sentiment with the actual price movement, which could strengthen the bullish outlook for the GBP.
- Volatility Discrepancy: The high volatility of the Long/Short Ratio (256.49%) compared to the relatively low volatility of the GBP/USD price (7.18%) is notable. This might indicate that commercial trader positioning is more volatile due to factors like hedging activities and a longer-term investment perspective, while the actual price movement can be influenced by a broader range of shorter-term factors.
- Potential Confirmation: The recent bullish shift in the Long/Short Ratio could provide confirmation for the GBP/USD uptrend. If commercial traders continue to reduce their short positions or increase their long positions, it could provide further fuel for the GBP/USD rally.
Trading implications and considerations
- Bullish Scenario: The convergence of bullish signals in both charts suggests a potential for continued GBP strength. Traders might consider long positions in GBP/USD, targeting the resistance level on the GBP/USD chart.
- Caution: It is crucial to remain cautious. The Long/Short Ratio is still in a long-term downtrend, and the recent bullish shift needs confirmation. Traders should monitor the price action closely and be prepared for potential reversals.
- Risk Management: Given the volatility of the Long/Short Ratio, traders should implement sound risk management strategies, including stop-loss orders and appropriate position sizing, to protect their capital.
- Fundamental Analysis: This technical analysis should be complemented with fundamental analysis. Factors such as interest rate differentials, economic data releases, and geopolitical events can significantly impact the GBP/USD exchange rate.
- Further Research: The “Tolerance” values mentioned require further investigation to fully understand their meaning and calculation for a complete analysis.
Conclusion
The charts present a complex yet potentially rewarding picture for GBP traders. While the long-term trend in the Commercial Long/Short Ratio has been bearish, recent price action and sentiment shifts suggest a potential bullish reversal, which is supported by the GBP/USD chart’s recent bullish momentum. Combining the insights from both charts offers a more comprehensive understanding of the GBP’s dynamics. Traders should carefully consider these factors, conduct thorough fundamental and technical research, and employ sound risk management strategies when trading the GBP.
Author

FxPro Traders Research Team
FxPro Traders
The FxPro Traders Research Team delivers advanced analysis and strategies designed to empower your success in today's dynamic forex markets.


