Data doubts linger as UK growth beats expectations

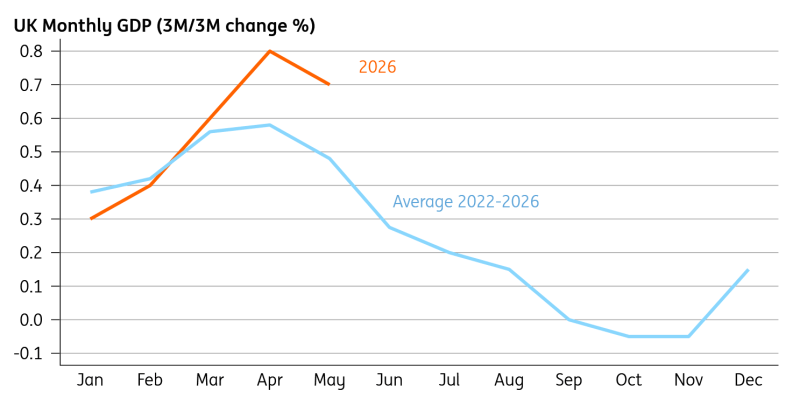
Ongoing strength in UK monthly GDP fits a familiar pattern seen in recent years, with growth tending to outperform in the opening months of the year before losing momentum later on. We expect activity to slow into the summer.
We’re still a bit dubious about the UK’s latest growth data. On the face of it, it looks great. Monthly GDP is up by 0.7% over the past three months, relative to the three prior months. Growth for May specifically was a tad better than expected at 0.1%, against expectations of no or even negative growth.
Yet there is still an active debate over how reflective this is of the underlying growth picture. Surveys are generally weaker; the services purchasing managers index turned markedly weaker in May. And the jobs market continues to paint a very different picture. Private sector payrolls are still falling, and the pace of weakness in consumer services is showing little sign of abating. The Bank of England’s Decision Maker Panel survey points to further modest declines in employment, too.
The strength in these monthly GDP figures also fits into an eerily familiar pattern, whereby, ever since 2022, the data has been considerably stronger in the first half of the year than the second. Though the Office for National Statistics analysis disputes this, we, like other economists, suspect there are underlying challenges with the way the data is being seasonally adjusted. It follows that we’re likely to see a marked slowdown in growth in the summer.
Growth this year fits into a familiar seasonal pattern
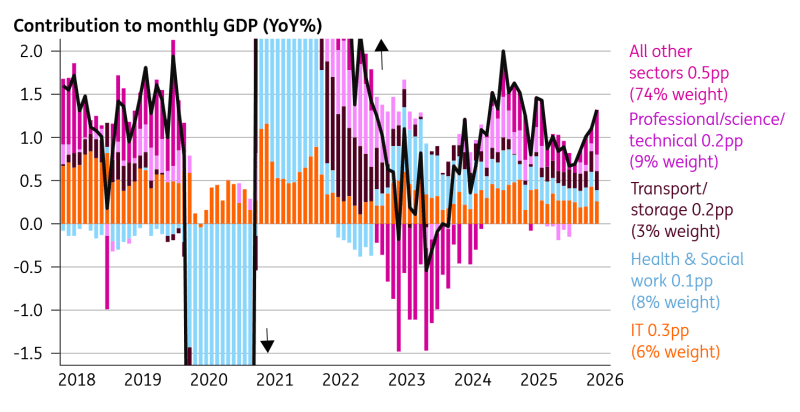
Notwithstanding those issues, it’s also interesting how concentrated growth has been in recent history. In annual terms, monthly GDP is growing by 1.3%. But 0.8pp of that comes from sectors representing only a quarter of overall output. The IT sector has consistently contributed a disproportionate amount of UK growth relative to its size, perhaps pointing to an AI effect. Though output here fell through May, that followed remarkable strength in March and April.
A few small sectors are driving UK GDP
The bottom line is the UK economy probably has genuinely had a reasonable start to 2026 – albeit not quite as strong as these growth numbers suggest. More importantly, the impact of the Iran war and the spike in energy prices is likely to show more clearly over the summer. We’d expect growth to slow to 0.1-0.2% in the third quarter, after what’s now likely to be 0.4% in Q2.
Author

ING Global Economics Team
ING Economic and Financial Analysis
From Trump to trade, FX to Brexit, ING’s global economists have it covered. Go to ING.com/THINK to stay a step ahead.