Daily market outlook and review

The Bank of Canada (BoC) increased the target for the Overnight Rate by 50 basis points to 4.25% from 3.75% on Wednesday, and noted the central bank will continue quantitative tightening. This comes after short-term interest rate markets priced in a 25 basis-point increase. This is also the central banks 7th consecutive rate hike and is the highest policy level seen in nearly 15 years, dragging the interest rate an eye-popping 400 basis points this year to tackle soaring inflation far beyond the central bank’s target.
The main point from the BoC’s Rate Statement was that policy tightening could be coming to an end:
Looking ahead, Governing Council will be considering whether the policy interest rate needs to rise further to bring supply and demand back into balance and return inflation to target. Governing Council continues to assess how tighter monetary policy is working to slow demand, how supply challenges are resolving, and how inflation and inflation expectations are responding. Quantitative tightening is complementing increases in the policy rate. We are resolute in our commitment to achieving the 2% inflation target and restoring price stability for Canadians.
The announcement was met with an immediate intraday sell-off in the USD/CAD, dropping 0.4% to a low of C$1.3588. However, follow-through selling proved thin. At the time of writing, the currency pair is poised to retest pre-announcement levels and conclude the day unchanged. Ultimately, therefore, the price movement that emerged from the release did little to the pair’s technical landscape.
Economic calendar today?
Pre-Recorded Welcome Address from ECB President Lagarde at 12 pm GMT.
US Initial Jobless Claims for the Week Ending 3 Dec at 1:30 pm GMT.
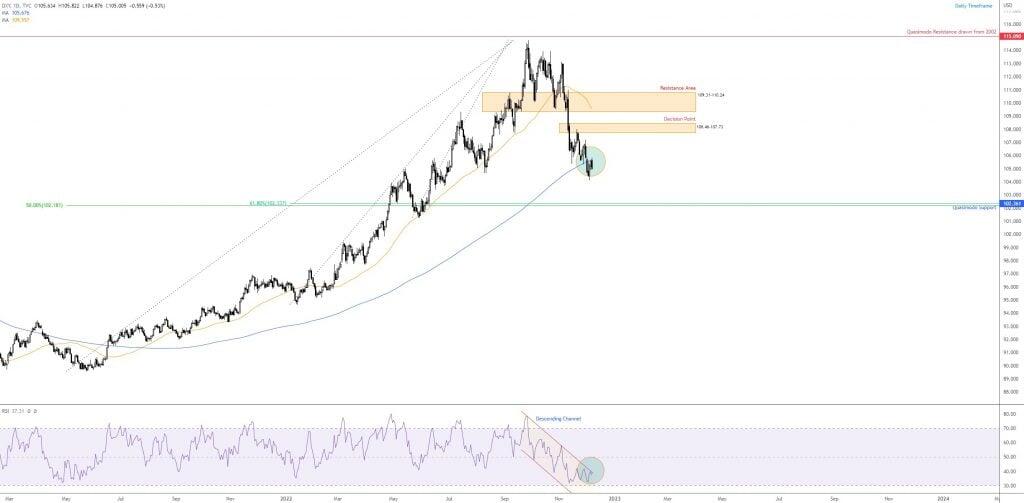
US Dollar Index rejecting underside of its 200-day simple moving average
Daily timeframe
The research team wrote about the US Dollar Index in Wednesday’s report, highlighting the possibility of price retesting the underside of its 200-day simple moving average, currently at 105.68. As you can see, price did indeed retest the dynamic value and has thus far been respected as resistance (mean reversion traders, maybe?).
It was also communicated in recent writing that the trend favours sellers. Dropping under the 200-day SMA offers a bearish indication. Another bearish cue, of course, is price structure forging a series of lower lows and lower highs since peaking at 114.78, alongside the 50-day simple moving average at 109.56 flattening out and dipping lower after pointing higher since June 2021. However, the 50-day SMA has yet to cross under the 200-day SMA to form what technicians will recognise as a Death Cross: action suggesting the possibility of a longer-term downtrend. It was also aired in a recent report that the relative strength index (RSI) value is testing channel resistance, extended from the high 78.21.
What does this mean for traders and investors, technically speaking?
Sellers appear to be in the driving seat for now. Continued rejection of the 200-day SMA as a resistance shines the technical spotlight as far south as support from 102.36, complemented by a 61.8% Fibonacci retracement ratio at 102.34 as well as a 50.0% retracement at 102.18.
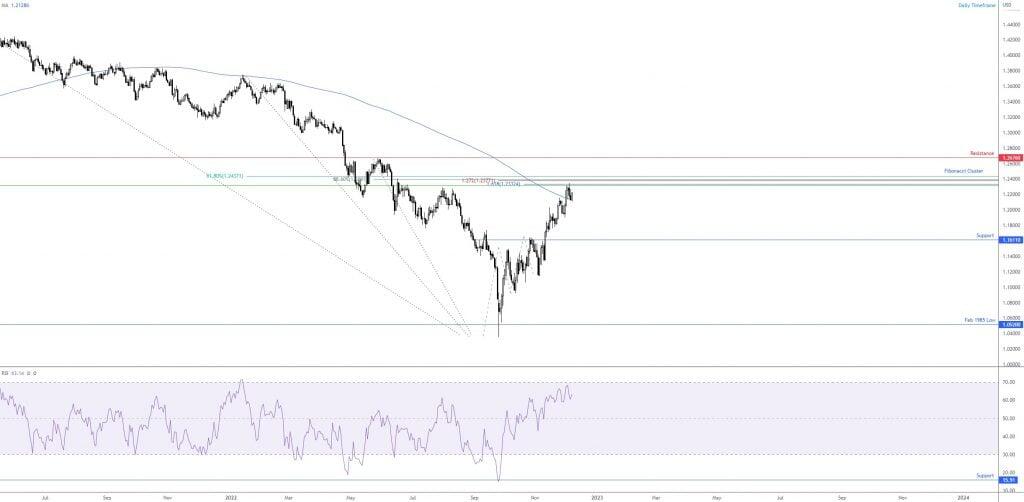
GBP/USD: Buyers and sellers squaring off between key areas
Daily timeframe
Sterling against the US dollar was a noted currency pair in previous writing. Today’s analysis focusses more on the daily timeframe’s technical structure and ultimately serves as a reminder of where the research team stands.
Current price movement is forging an early consolidation between a Fibonacci cluster at $1.2317-1.2437 (note that the 50.0% retracement is not a Fibonacci ratio) and the widely watched 200-day simple moving average, currently fluctuating around $1.2129. As you can see, the unit recently retested the moving average and has established a bullish setting.
Therefore, the fight remains between the 200-day SMA and the Fibonacci cluster resistance. A breakout lower shows limited support until around $1.1611, while pushing higher casts light on resistance from $1.2676.
Interestingly, the trend on the daily timeframe remains to the upside, consequently supporting a possible push north. On the other side of the fence, however, weekly resistance is in play around $1.2263, bolstering the possibility of a dip south.
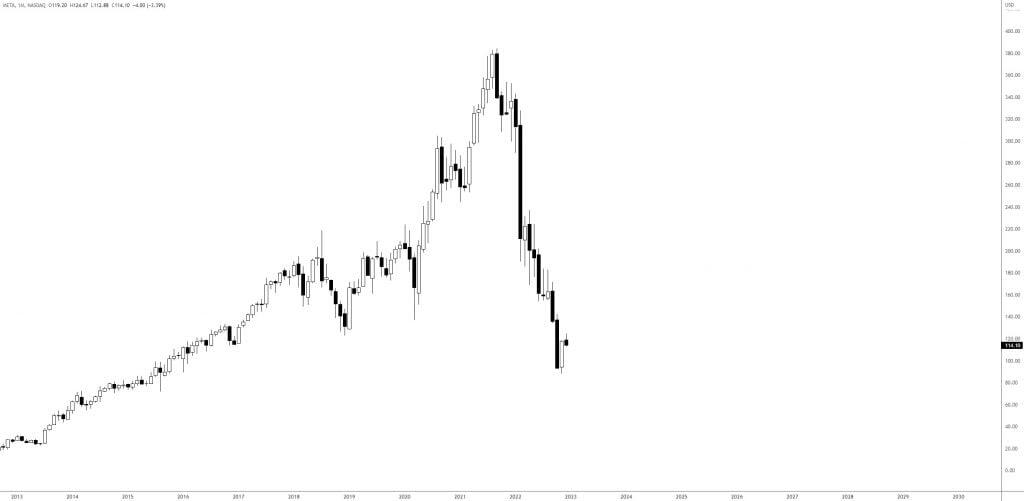
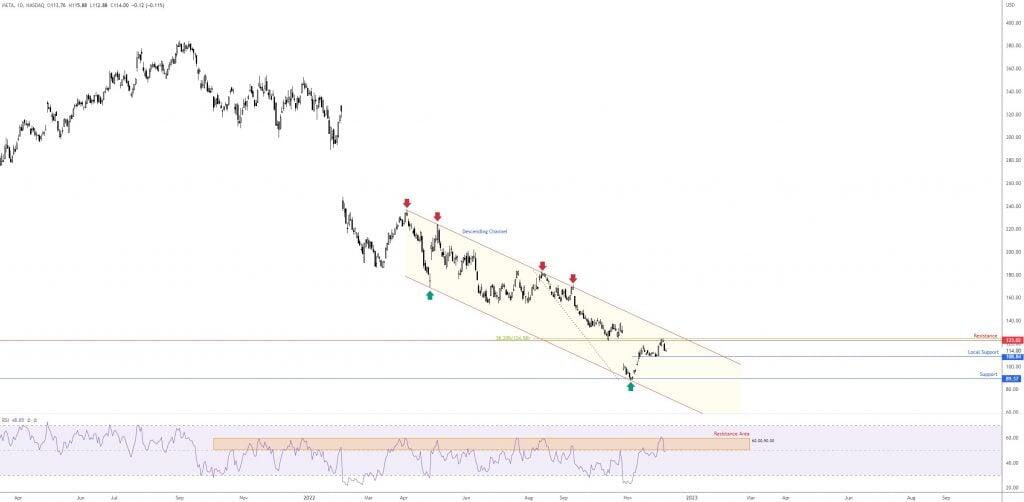
META: Price denying resistance
Daily timeframe
Since September 2021, the share price of META has plunged nearly 80%. It’s safe to say this stock is in a downtrend (check the monthly timeframe below for an eye-opening view of this action).
Early November observed price rebound from support at $89.37, complemented by channel support, etched from the low $169.00, in addition to oversold conditions derived from the relative strength index (RSI). It is also worth pointing out that the RSI is rejecting resistance between 60.00 and 50.00 (an area frequently viewed as a temporary overbought zone in downtrending environments), in place since November 2021.
The rebound from the noted support saw the unit fill a substantial downside gap (27 October) and shake hands with resistance from $123.00 and a 38.2% Fibonacci retracement at $124.58. Directly above resides channel resistance, drawn from the high $236.86. Local support at $108.84 now calls for attention, with a break likely to see the unit readdress $89.37 support.
Overall, this remains a sellers’ market for the time being. Breakout sellers are likely to be positioned south of support from $108.84, targeting support from $89.37.
Author

Aaron Hill
FP Markets
After completing his Bachelor’s degree in English and Creative Writing in the UK, and subsequently spending a handful of years teaching English as a foreign language teacher around Asia, Aaron was introduced to financial trading,


