D-Bank Torpedoes Markets

Good Morning Traders,
As of this writing 4:10 AM EST, here's what we see:
US Dollar: Dec. USD is Up at 95.675.
Energies: November Crude is Down at 47.10.
Financials: The Dec 30 year bond is Up 10 ticks and trading at 169.30.
Indices: The December S&P 500 emini ES contract is 41 ticks lower and trading at 2138.25.
Gold: The October gold contract is trading Up at 1323.10. Gold is 14 ticks higher than its close.
Initial Conclusion
This is not a correlated market. The dollar is Up+ and crude is Down- which is normal and the 30 year bond is trading Up. The Financials should always correlate with the US dollar such that if the dollar is lower then bonds should follow and vice-versa. The indices are Down and Crude is trading Down which is not correlated. Gold is trading Up which is not correlated with the US dollar trading Up. I tend to believe that Gold has an inverse relationship with the US Dollar as when the US Dollar is down, Gold tends to rise in value and vice-versa. Think of it as a seesaw, when one is up the other should be down. I point this out to you to make you aware that when we don't have a correlated market, it means something is wrong. As traders you need to be aware of this and proceed with your eyes wide open.
All of Asia traded lower with the exception of the Shanghai exchange which traded higher. As of this writing all of Europe is trading lower.
Possible Challenges To Traders Today
– Core PCE Price Index m/m is out at 8:30 AM EST. This is major.
– Personal Spending m/m is out at 8:30 AM EST. This is major.
– Personal Income m/m is out at 8:30 AM EST. This is major.
– Chicago PMI is out at 9:45 AM EST. This is not major.
– Revised UoM Consumer Sentiment is out at 10 AM. This is not major.
– Revised UoM Inflation Expectations are out at 10 AM. This is not major.
Treasuries
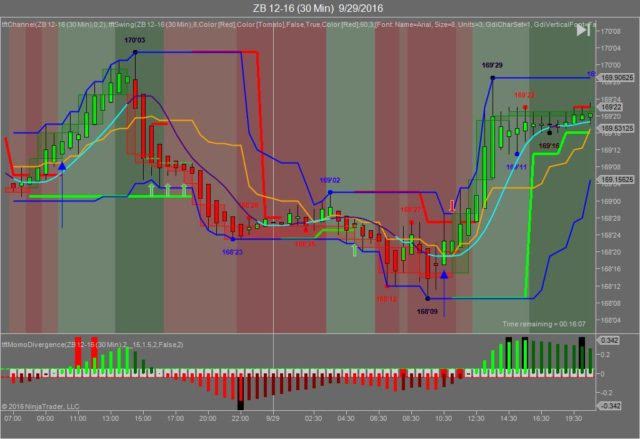
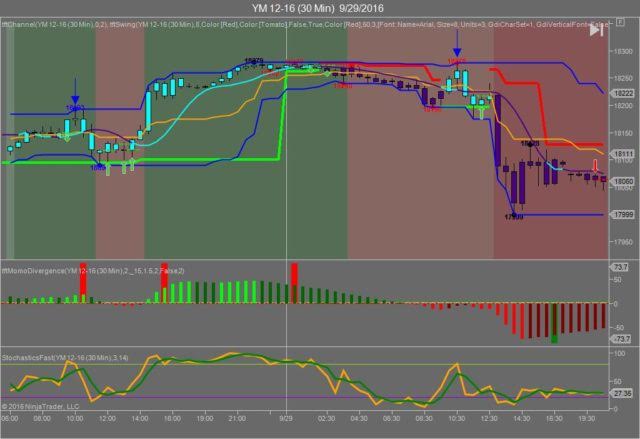
We've elected to switch gears a bit and show correlation between the 30 year bond (ZB) and The YM futures contract. The YM contract is the DJIA and the purpose is to show reverse correlation between the two instruments. Remember it's liken to a seesaw, when up goes up the other should go down and vice versa.
Yesterday the ZB made it's move at around 10:30 AM EST at around the time Nat Gas Storage was reported. The ZB hit a low at around that time and the YM hit a high. If you look at the charts below ZB gave a signal at around 10:30 AM EST and the YM was moving lower at the same time. Look at the charts below and you'll see a pattern for both assets. ZB hit a low at around 10:30 AM EST and the YM hit a high. These charts represent the latest version of Trend Following Trades and I've changed the timeframe to a 30 minute chart to display better. This represented a long opportunity on the 30 year bond, as a trader you could have netted about 50 plus ticks per contract on this trade. Each tick is worth $31.25. We added a Donchian Channel to the charts to show the signals more clearly.
Charts Courtesy of Trend Following Trades built on a NinjaTrader platform
Bias
Yesterday we gave the markets a neutral bias as we weren't convinced that the indices had any conviction. The Dow dropped 196 points and the other indices lost ground as well. Today we aren't dealing with a correlated market and our bias is to the downside.
Could this change? Of Course. Remember anything can happen in a volatile market.
Commentary
So what happened to all those nice gains we saw earlier in the week? Was it economic news that brought it down? Donald Trump? Janet Yellen? No. It was brought about by the news that Deutsche Bank may be failing and the German government has no plan to help or bail them out. Just what the world needs, another crisis and it seems as though it's one crisis after another. This one however will have a global impact as Deutsche Bank is considered a power house in the banking industry. This is not just the "Cadillac" of the banking but the "Rolls Royce". This is liken to Lehman Brothers from 2008 and will have a worldwide effect on the markets. We advised readers of this newsletter to stay out of the markets yesterday via our neutral bias; which means the markets could go in any direction.
Author

Nick Mastrandrea
Market Tea Leaves


