Curve Inversion and Chaos to Begin by December 2017
The bounce in Treasury yields witnessed after the election of Donald Trump is now decaying in the D.C. swamp. If the Fed continues to ignore this slow growth and deflationary signal from the bond market and continues along its current rate hiking path, the yield curve will invert by the end of this year and an equity market plunge and a recession is sure to follow.
An inverted yield curve, which has correctly predicted the last seven recessions going back to the late 1960’s, occurs when short-term interest rates yield more than longer-term rates. Why is an inverted yield curve so crucial in determining the direction of markets and the economy? Because when bank assets (longer-duration loans) generate less income than bank liabilities (short-term deposits), the incentive to make new loans dries up along with the money supply. And when asset bubbles are starved of that monetary fuel they burst. The severity of the recession depends on the intensity of the asset bubbles in existence prior to the inversion.
The Federal Reserve has traditionally controlled overnight lending rates between banks. That all changed when the Fed started to buy longer-term Treasuries and Mortgage Backed Securities as a result of the Great Recession. Nevertheless, outside of these QE programs, the long end of the yield curve is primarily influenced by the inflationary expectations of investors. The yield curve inverts when central banks believe inflation is headed higher; but bond investors are convinced of the opposite.
The last two times the yield curve inverted was in the years 2000 and 2006. The inversion and subsequent recession that began in the year 2000 caused NASDAQ stocks to plummet 80%. The next inversion engendered the Great Recession in which the S&P 500 dropped 50% and, according to the Case/Shiller 20-City Composite Index, home prices fell over 30%.
This next inversion will occur in the context of record high equity, real estate and bond market valuations that will require another government bailout. However, this time around the recession will commence with the balance sheets of the Fed and Treasury extremely overleveraged right from the start.
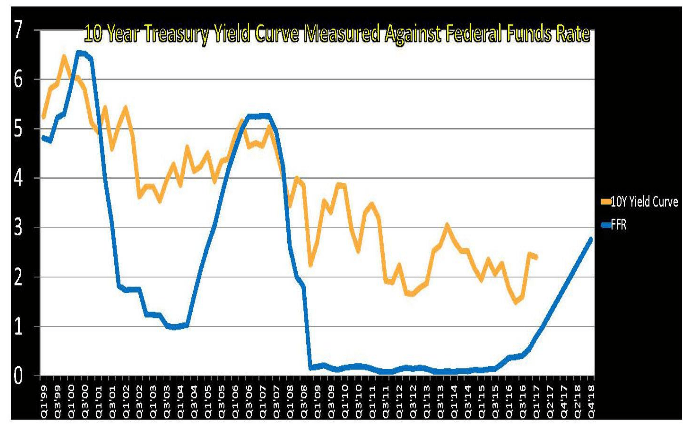
As you can see from the chart below, if the 10-year Note yield (orange line) continues to fall along its current trajectory; and the Fed plods along with its avowed Dot Plot hiking path (blue line), the yield curve should invert around the end of 2017. Market chaos and another brutal recession should soon follow.
What could prevent this baneful scenario from happing?
One of the most popular Wall Street myths is that long-term interest rates rise simply because the Fed is raising the Fed Funds Rate (F.F.R.). This normally occurs because the central bank is trying to catch up to rising inflation and is initially behind the curve. However, later on in the tightening cycle long rates begin to decline as inflation is stamped out of the economy.
For example, from June 2004 thru June 2006 the Fed raised the F.F.R. from 1%-5.25%; but the 10-year note only increased from 4.7%-5.2%. That means the Benchmark Note went up just 50 bps even though the F.F.R. was raised by 425 bps. What is especially notable here is that GDP growth was well above 3% in both 2005 and 2006; as opposed to today’s environment of 1.6% GDP growth for all of 2016, and just 1.2% in Q1 2017. The fear of recession and deflation is the primary reason why the 10-year Note yield is currently falling.
The Fed has been tightening monetary policy since it started to taper its $80 billion per month QE program back in December 2013. It has subsequently raised rates three times and is now most likely already ahead of the curve due to the anemic state of the economy. But, as always, the Fed fails to read the correct economic indicators and is now fixated on the low unemployment rate and its dubious effect on inflation.
Some argue that the yield curve won’t invert if economic growth stalls because the Fed will then truncate its rate hike path. And indeed there is a lot of evidence for the Q2 recovery narrative to be proven false. For instance, April data on existing home contract closings declined 2.3% m/m, to a 5.57 million annual rate vs. a forecast of 5.65 million. And new homes weren’t much better as single family home sales declined 11.4% to 569,000 annualized vs. the 610,000 forecast. Pending home sales also disappointed falling 1.3%. Then we had Durable Goods falling 0.7%, and Core Capital Goods orders showed no growth at all.
These data points highlight the reality that Q2 will not spring higher from the anemic Q1 growth rate. But the problem is that the F.F.R. is already close to 1%. Therefore, even if we get just two more hikes before the Fed realizes growth is faltering, that rate will be near 1.5%. In the economy slows enough that even the Fed takes notice, the 10-year Note yield should retreat back to where it was in July of 2015 (1.35%). In this second scenario, the yield curve inverts despite the Fed’s failure to consummate its Dot Plot plan.
Of course, there is a small chance that the yield curve doesn’t invert due to an aggressive reverse QE program--a very quick unwinding of the Fed’s $4.5 trillion balance sheet. While this may avoid an inversion of the yield curve, it would also siphon off capital from the private sector, as investors divert yet more money to the Treasury. An aggressive selling of the Fed’s balance sheet is a very unlikely scenario given the minutes of the May FOMC meeting. In that meeting the Fed decided to merely taper the re-investment of its balance sheet, which is the pace in that it stops reinvesting its assets. With a total debt to GDP ratio of 350%, this third scenario has very low odds of occurring; but should remand the economy into a recession even if such a plan is deployed.
Therefore, the only rational way to avoid an inverted yield curve, market chaos and a recession is if long-term Treasury yields reverse their long-term trend lower due to a rapid increase in GDP growth. This would only occur if Trump’s agenda of repatriation of foreign earnings, tax cuts and infrastructure spending is imminently adopted. But the probability of this happening very soon is getting lower by the day.
An inverted yield curve will lead to market disorder as it did in 2000 and 2006. But this next recession starts with our National debt over $20 trillion dollars and the Feds Balance Sheet at $4.5 trillion. Therefore, when the yield curve inverts for the third time this century you can expect unprecedented chaos in markets and the economy to follow shortly after. This is because the yield curve will not only invert at a much lower starting point than at any other time in history, but also with the Fed and Treasury’s balance sheets already severely impaired.
There will be unprecedented volatility between inflation and deflation cycles in the future due to these factors. This represents a huge opportunity for those that can identify these inflexions points and know where to invest. To be just a bit more specific, sell your long positions now and get short once the curve inverts; and then get prepared to hedge against intractable inflation when the Fed responds to this next collapse with helicopter money.
Author

Michael Pento
Pento Portfolio Strategies
Mr. Michael Pento is the President of Pento Portfolio Strategies and serves as Senior Market Analyst for Baltimore-based research firm Agora Financial. Pento Portfolio Strategies provides strategic advice and research for institutional clients.


