Crude Oil – General Market Link

On Thursday, the overall situation in crude oil hasn’t changed much as the commodity wavered around the January peak. Will the relationship between black gold and the general market give us more clues about future moves?
Crude Oil’s Technical Picture
Let’s examine the technical picture of the commodity
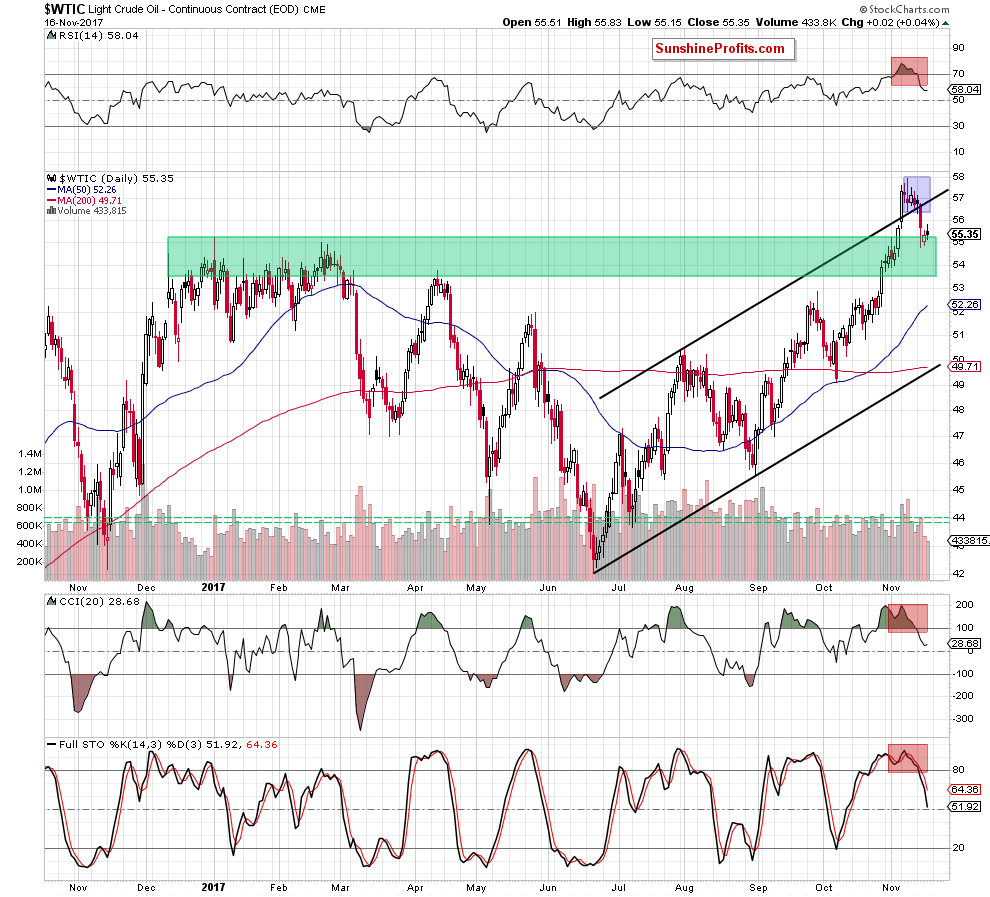
From today’s point of view, we see that yesterday session didn’t add anything new to the short-term picture of crude oil. As you see, the commodity re-tested once again the January high, but then rebounded slightly – similarly to what we saw a day earlier.
The size of volume was disappointing (we haven’t seen such low volume since mid-September), which may suggests some uncertainty about the direction of the next bigger move. Nevertheless, taking into account the fact that oil bears had some problems with the successful breakdown under the January peak, it seems that their opponents could try to push crude oil higher in the coming day(s).
If they manage to do it, we may see an increase even to $56.41 (the lower border of the blue consolidation) or $56.85, where the previously-broken upper border of the black rising trend channel currently is. Will such increase change anything in the short term? Not really, because we saw similar rebounds in the past, which usually were nothing more than verifications of the earlier breakdowns.
Therefore, in our opinion, as long as there is no invalidation of the breakdown under the black resistance line, lower prices of light crude are more likely than not – especially when we factor in the Tuesday price action (an invalidation of the earlier breakout), the sell signals generated by the indicators and what we wrote on Wednesday about the current situation in the oil-to-gold ratio (if you haven’t had the chance to read that alert, we encourage you to do so today).
And speaking about the ratio… in recent days you could read about the relationship between crude oil and gold. Today, we decided to go one step further and examine the connection between light crude and the general stock market.
Crude Oil – General Market Link
The long-term picture does not give us too many clues about future movements as the ratio remains between the red resistance zone (created by the 2016 and 2017 highs) and the green support area. Nevertheless, the size of the recent candlesticks can be disappointing for many bulls as they are getting smaller. Although this month candlestick is not finished yet, we have to unanimously admit that October candlestick was smaller than the previous one, which raises some doubts about the strength of the upward move
Will the medium-chart be more useful and abundant in the tips on future moves? Let’s check.
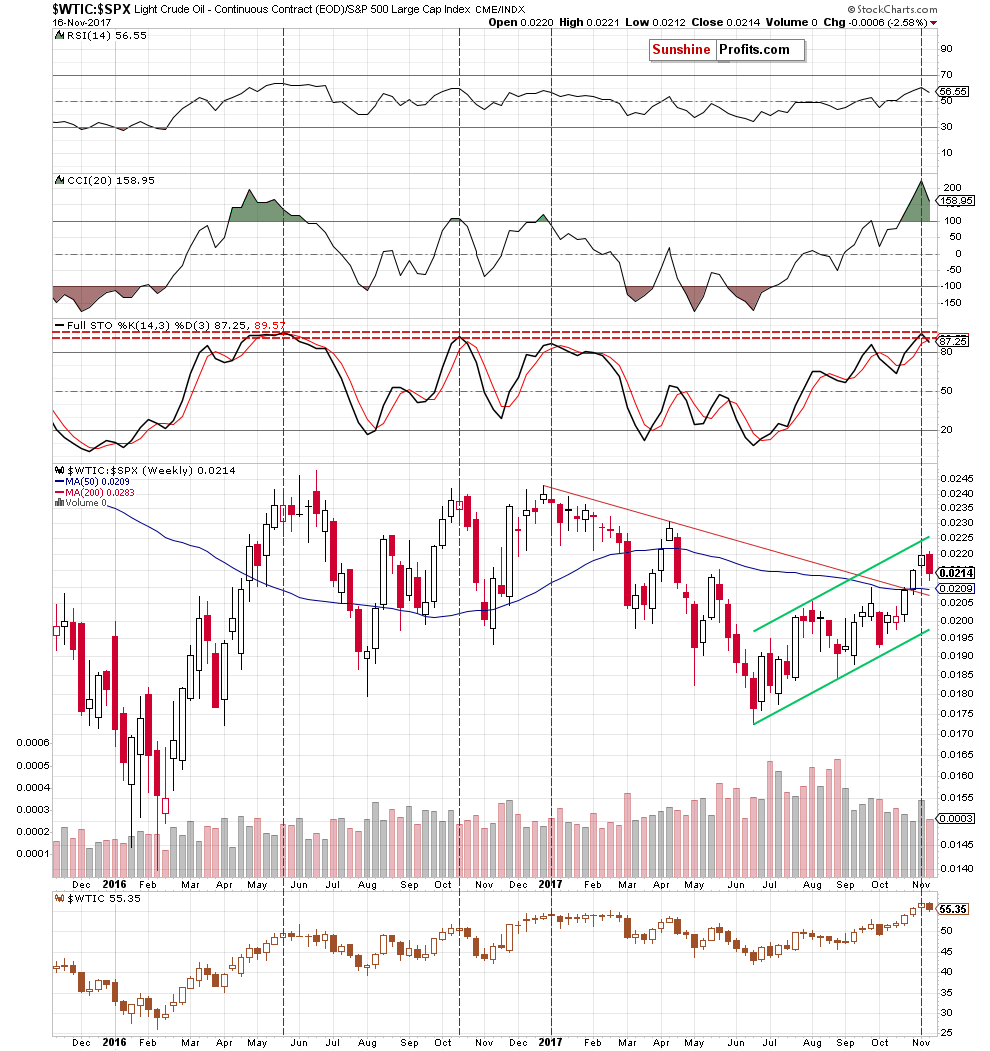
From this perspective, we see that the ratio increased to the upper border of the green rising trend channel and then pulled back a bit in the previous week. This unsuccessful attempt to go higher encouraged the bears to act, which resulted in further deterioration this week. Additionally, the Stochastic Oscillator generated a sell signal, suggesting lower values of the ratio in the following week(s).
What does it mean for crude oil? Similarly to wrote yesterday in the case of the oil-to-gold ratio, we see on the above charts that there is a positive correlation between the oil-to-stocks ratio and black gold, which means that if it reverses and declines, it will likely translate into lower prices of crude oil in the coming week(s) – similarly to what we saw in the previous months.
Nevertheless, in our opinion, this pro bearish scenario will be even more likely if the ratio closes this week under 0.0220. Why? At this value the ratio closed the previous week, which means that if we see a weekly closure below this level later today, the bears will get another argument for action - the pro-bearish candlestick formation - the bearish engulfing pattern.
Taking into account the above-mentioned positive correlation between the ratio and crude oil, we can see an analogical situation on the weekly chart of black gold below.
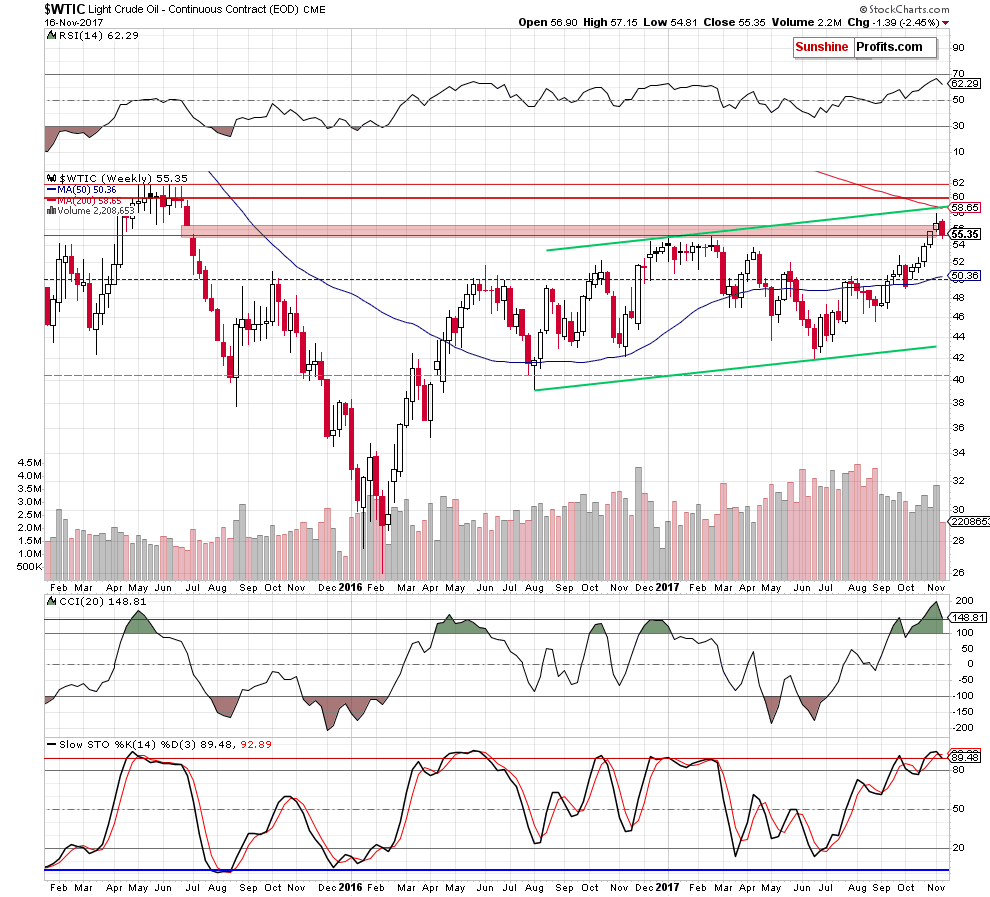
There are three white candlesticks, which were getting smaller in the previous weeks. This first show of oil bulls’ weakness resulted in a pullback last week and further deterioration in recent days.
How can we interpret this situation from the psychological point of view? Those investors, who had long positions decided to close them in the previous week, which resulted in a longer shadow of the last white candle. Earlier this week, the price declined and those who joined the last part of the rally didn’t withstand the pressure and began to close their positions in fear of losses, which caused that the price of crude oil continued to fall.
Therefore, if we see the bearish engulfing patterns on the weekly charts (in the case of crude oil and the oil-to-stocks ratio), it will be an additional signal for investors to open more short positions (or, as in our case, increase the size of short positions that were opened right after the November 8 high-volume reversal), which due to the absence of the opposite side (the previous ones who closed their positions due to fear of losses will not re-open them in the same direction) will push the price even lower in the coming week. Nevertheless, before we consider this option, we’ll wait for the confirmation and the weekly closing price. As always, we’ll keep you - our subscribers - informed should anything change.
Before we summarize today’s alert, we would like to point out that if you would like to know more about the general stock market.
Summing up, short (already profitable) positions continue to be justified from the risk/reward perspective as the technical picture of crude oil and the above-mentioned ratio suggests that lower prices of crude oil are just around the corner (even if we see a verification of this week’s breakdown under the upper border of the black rising trend channel first).
Want free follow-ups to the above article and details not available to 99%+ investors? Sign up to our free newsletter today!
Author

Nadia Simmons
Sunshine Profits


