CPI gives markets CPR

USD: Mar '24 is Down at 104.780.
Energies: Mar '24 Crude is Down at 77.50
Financials: The Mar '24 30 Year T-Bond is Up 11 ticks and trading at 118.10.
Indices: The Mar '24 S&P 500 emini ES contract is 100 ticks Higher and trading at 4996.50.
Gold: The Feb'24 Gold contract is trading Down at 2005.40.
Initial conclusion
This is not a correlated market. The USD is Down and Crude is Down which is not normal, but the 30 Year T-Bond is trading Higher. The Financials should always correlate with the US dollar such that if the dollar is Higher, then the bonds should follow and vice-versa. The S&P is Higher and Crude is trading Lower which is correlated. Gold is trading Lower which is not correlated with the US dollar trading Down. I tend to believe that Gold has an inverse relationship with the US Dollar as when the US Dollar is down, Gold tends to rise in value and vice-versa. Think of it as a seesaw, when one is up the other should be down. I point this out to you to make you aware that when we don't have a correlated market, it means something is wrong. As traders you need to be aware of this and proceed with your eyes wide open. Asia is trading Mixed with half the exchanges Higher and the other half Lower. Currently all of Europe is trading Higher.
Possible challenges to traders
-
Crude Oil Inventories is out at 10:30 AM EST. This is Major.
-
FOMC Member Barr Speaks at 4 PM EST. This is Not Major.
Treasuries
Traders, please note that we've changed the Bond instrument from the 30 year (ZB) to the 10 year (ZN). They work exactly the same.
We've elected to switch gears a bit and show correlation between the 10-year bond (ZN) and the S&P futures contract. The S&P contract is the Standard and Poor's, and the purpose is to show reverse correlation between the two instruments. Remember it's likened to a seesaw, when up goes up the other should go down and vice versa.
Yesterday the ZN migrated Higher at around 8:30 AM EST as the S&P hit a High at around the same time. If you look at the charts below the S&P gave a signal at around 8:30 AM and the ZN started its Upward trend. Look at the charts below and you'll see a pattern for both assets. S&P hit a High at around 8:30 AM and migrated Lower. These charts represent the newest version of MultiCharts and I've changed the timeframe to a 15-minute chart to display better. This represented a Long opportunity on the 10-year note, as a trader you could have netted about a dozen ticks per contract on this trade. Each tick is worth $15.625. Please note: the front month for the ZN is now Mar '24. The S&P contract is now Mar' 24. I've changed the format to filled Candlesticks (not hollow) such that it may be more apparent and visible.
Charts courtesy of MultiCharts built on an AMP platform
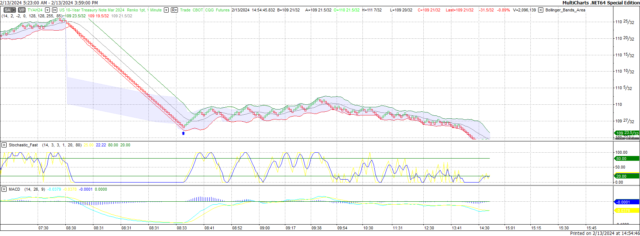
ZN - Mar 2024 - 02/13/24
-638435130561139769.png)
S&P - Mar 2024 - 02/13/24
Bias
Yesterday we gave the markets a Downside bias as Crude, Bonds and Gold were all trading Higher and that usually reflects a Down Day. The markets didn't disappoint as the Dow fell 525 points and the other indices fell as well. Today we aren't dealing with a correlated market and our bias is to the Upside.
Could this change? Of Course. Remember anything can happen in a volatile market.
Commentary
Yesterday morning as soon as the CPI data was released the markets made a complete nosedive, the like of which we haven't seen in quite some time. At its lowest level the Dow dropped over 700 points and I can't recall the last time that happened, but it did. Why? CPI did not fall as much as expected or predicted. This is a key report that the Federal Reserve will use to determine if interest rate reductions are warranted or not. Today we have Crude Oil Inventories out at 10:30 AM EST and an FOMC Member speaking at 4 PM. The FOMC Member speaking wasn't listed as Major because he speaks at 4 PM when the market closes so whatever he says shouldn't have an impact on today's session.
Author

Nick Mastrandrea
Market Tea Leaves
Nick Mastrandrea over 20 years experience in trading and formerly held a NASD Series 7. He currently holds a NJ Life, Health and Variable Authority. Nick is a published writer and his work has appeared in Futures Magazine, TraderPlanet and others.


