COVID-19 accelerates the trend of people moving out of the largest cities

New Geography has an interesting set of chart on how the pandemic affected population changes in the largest cities.
Data Census Department, chart New Geography, Red and Green Spotlights by Mish
CBSA stands for Core Based Statistical Areas (metropolitan areas and micropolitan areas), non-rural.
Areas outside CBSA’s are not rural, they are simply not in metropolitan or micropolitan areas. According to the Office of Management and Budget, “The CBSA classification is not an urban-rural classification; Metropolitan and Micropolitan Statistical Areas and many counties outside CBSAs contain both urban and rural populations.”
New Geography notes Domestic Migration Trend Accelerates
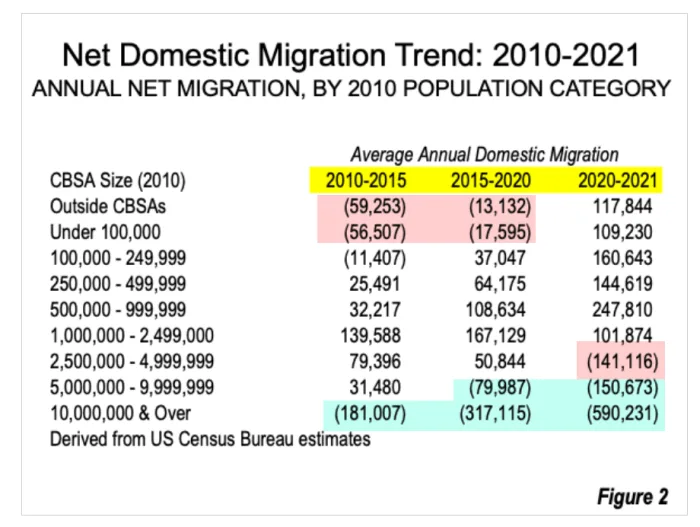
Annual net migration notes
-
These are metro area migrations. There are no cities over 10 million in population.
-
My red highlights are continuations of trends but represent reversals from 2015-2020. note reversals.
-
My green highlights note the strongest continuation of existing flight out of the biggest cities.
-
Also note unmarked line and the trend for line 1,000,000 to 2,499,000.
-
In general, metro areas over 1,000,000 in population are losing residents while every other category is gaining population.
Percentage migration
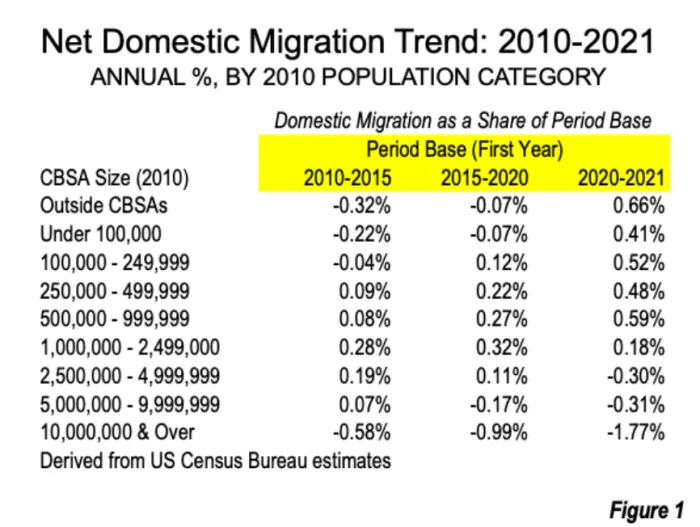
Percentage migration chart notes
-
The 10 million+ metro area group consists of just two areas New York and Los Angeles.
-
Those two largest areas area are getting exodus clobbered.
-
The Metro areas under 1 million are the big gainers.
Annual net domestic migration 2010-2021
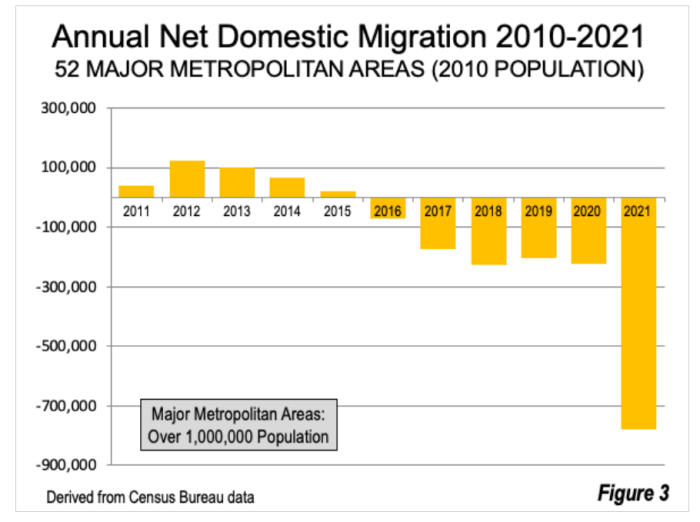
In general, people want out of the biggest cities. The leap in 2021 was impressive, if not shocking.
New geography specifics
- The largest overall net domestic migration gain was in the metropolitan areas with from 500,000 to 999,999 population in 2010, at 248,000. This was nearly eight times the average from 2010 to 2015. The largest gainers were Sarasota, FL, at 29,000, Cape Coral, FL, at 26,000, Lakeland, FL, at 25,000 and Boise, ID, at 24,000.
-
The 250,000 to 499,999 2010 population category added net domestic migrants in 2021 at nearly six times the rate of 2010-2015. The largest gainers were Myrtle Beach, SC-NC, at 22,000 and Port St. Lucie, FL, at 16,000. The largest losses were in Salinas, CA and Santa Maria (Santa Barbara), CA at between 3,000 and 4,000.
-
The 100,000 to 249,999 2010 population category lost an average of 11,000 net domestic migrants, and increased to 161,000 in 2020-2021. The leaders in this category were Punta Gorda, FL and St. George, UT, at 9,000. Even with this gain, a number of CBSAs sustained losses, and the largest in this category was in Lake Charles, LA, at 12,000.
Largest percentage net domestic migration
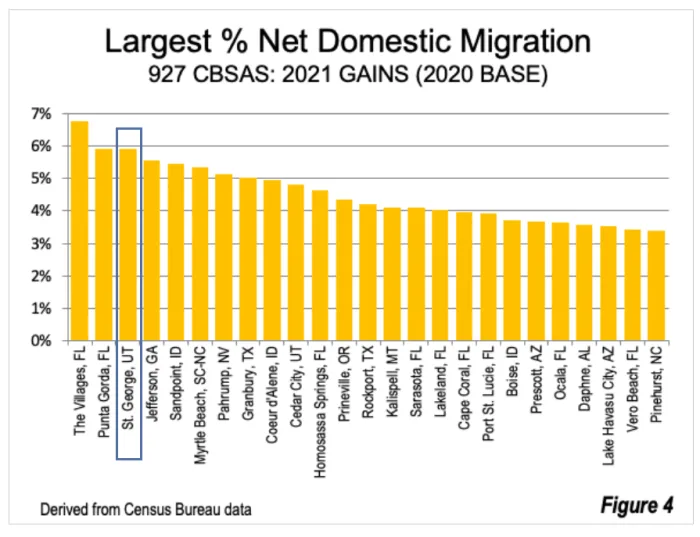
Data Census Department, chart New Geography, Blue Box Highlight by Mish
I am part of two groups in these charts. We escaped Crystal Lake Illinois in 2020. It's a part of the Chicago Metro Area. We moved to St. George, UT, the third largest percentage gainer.
How much of this is COVID-19 related vs retirement?
A huge wave of boomers were headed towards retirement before the pandemic hit. Some of that retirement and retirement-related movement was going to happen anyway.
Covid clearly accelerated things, but some of this was going to happen anyway. The George Floyd riots likely had an impact too.
So do school systems, school policies, and big city taxes.
Why St. George?
-
The metro area has a population of about 180,000 and the city proper about 95,000. It has a lot of services and things to do with many excellent golf courses.
-
The city has its own airport but the Las Vegas International Airport is just 1.5 hours away. A shuttle is under $50.
-
Photography, photography, photography.
Regarding point three, there are four national parks within a few hours and about seven within six hours.
Zion national park is just over an hour away. And in the summer when it's blistering hot, the North Rim of the Grand Canyon is only 2.5 hours away with temperatures in the 70s.
Author

Mike “Mish” Shedlock's
Sitka Pacific Capital Management,Llc


