Core PCE in line as labor cools, USD/JPY, Nasdaq at inflection

As we head into the end of the week, several economic announcements stand out:
Core PCE Inflation (Nov 2025): The Fed’s preferred gauge held at 2.8% year‑over‑year, ticking up from 2.7% in October. On a monthly basis, prices rose 0.2%, suggesting price pressures remain steady.
Initial Jobless Claims (week of Jan 17, 2026): Claims nudged higher to 200 k, just 1 k above the prior week and well below forecasts. Continuing claims fell to 1.849 m, reinforcing the “low‑hiring, low‑firing” labour market narrative.
Q3 GDP Revision: The Bureau of Economic Analysis revised third‑quarter GDP growth up to 4.4% annualised, the fastest pace in two years. Consumer spending rose a solid 0.5% in both October and November.
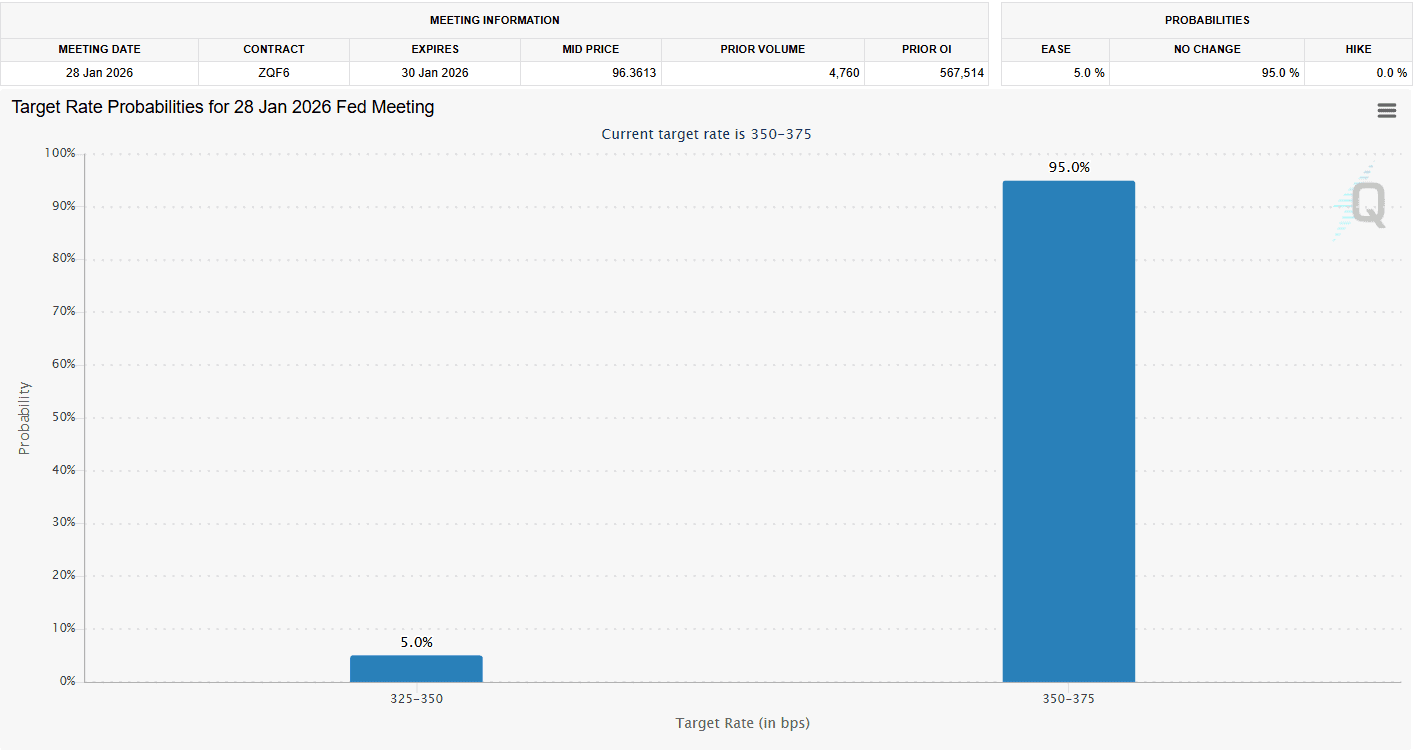
FOMC Meeting Next Week: The first Fed meeting of 2026 (Jan 27–28) looms, with markets expecting the Fed to hold rates steady and watch data.
Looking ahead, the first FOMC meeting of 2026 takes place next week. Markets are broadly expecting the Fed to hold rates steady and continue watching incoming data rather than rush into any policy shift.
Alongside the data, broader news flow remains noisy but contained. Tariff headlines have cooled for now, while earnings volatility is back in focus after Intel’s miss reminded markets that high expectations still come with consequences.
The key takeaway is simple. Steady inflation and a gradually cooling labour market are not enough, on their own, to push markets decisively in either direction.
The key story here is that steady inflation and a cooling labour market are not, by themselves, moving markets.
Inflation remains above the Fed’s 2% target, but it is no longer accelerating. Labour conditions are softening at the edges, yet jobless claims remain near cycle lows. There is no obvious macro stress signal here.
This backdrop removes pressure for immediate rate cuts, but it also limits the case for further tightening. As a result, the next rate decision for the Fed Reserve is also projected at 95% for a rate hold.
Markets have shifted their focus away from macro shock and toward relative value, positioning, and cross-asset flows.
That shift is starting to show up in price action. Equity indices remain near highs, but leadership is fragmenting. Large-cap tech is no longer doing all the heavy lifting, while small caps and more cyclical areas are beginning to participate.
The result is a market that feels rotational rather than directional. Upside attempts stall near key control levels, downside moves struggle to follow through, and headlines drive short-term volatility while flows do the real work underneath.
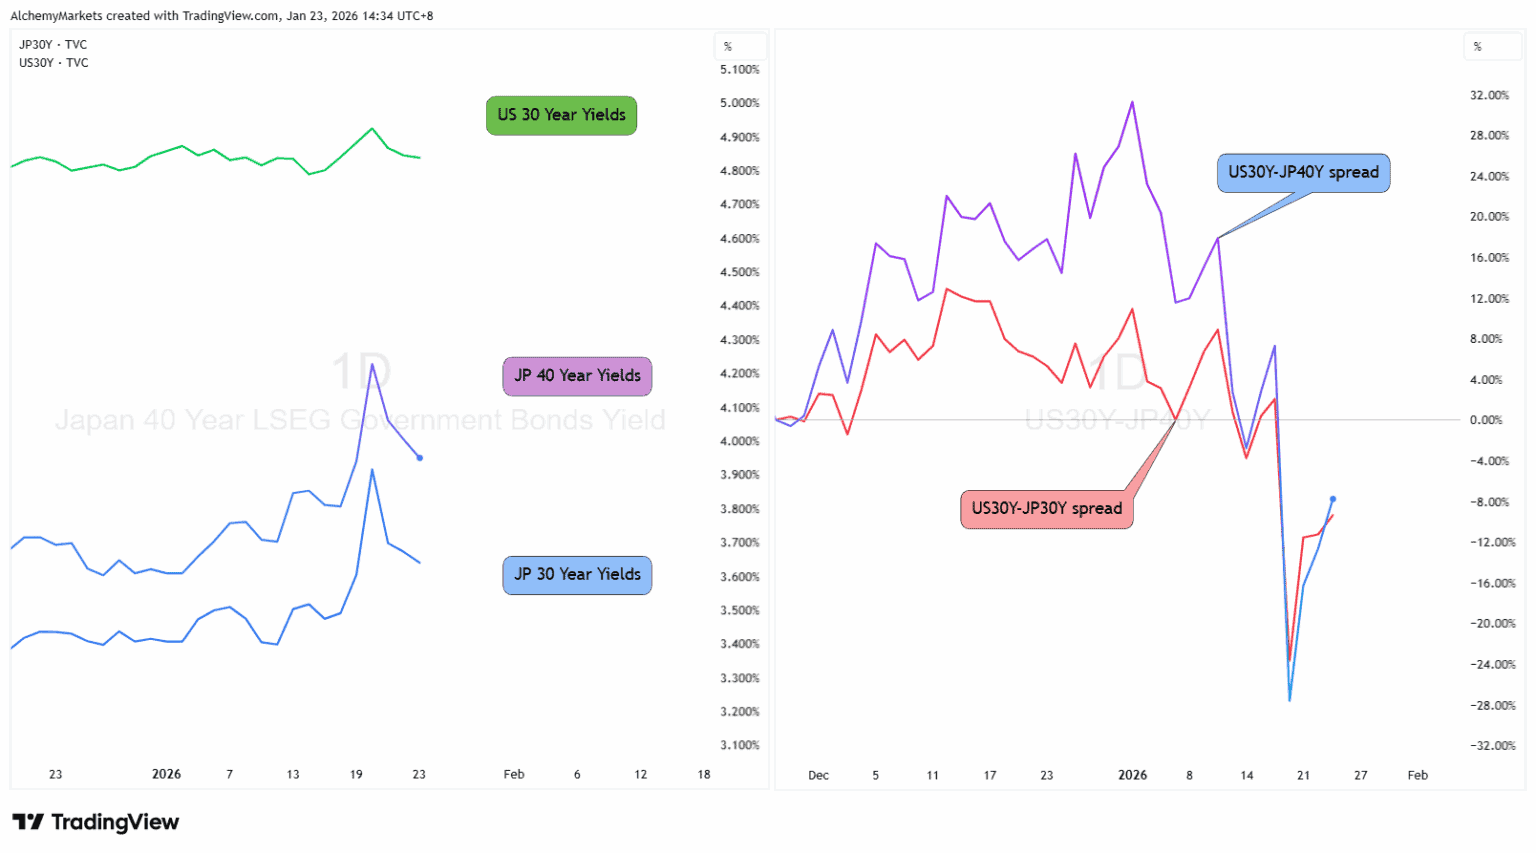
US–Japan yield spread — Structural shift in liquidity
A simple look at the US 30-year minus Japan 30-year yield spread explains why FX is behaving differently right now.
The spread has narrowed sharply from its late-2025 highs as Japanese yields climb faster than US yields. This is a quiet but important shift under the surface.
When the spread compresses:
- Carry trades become less attractive.
- Global liquidity becomes more selective.
- FX volatility tends to rise before equity volatility does.
This under-the-hood change is the plumbing behind the recent chop across risk assets.
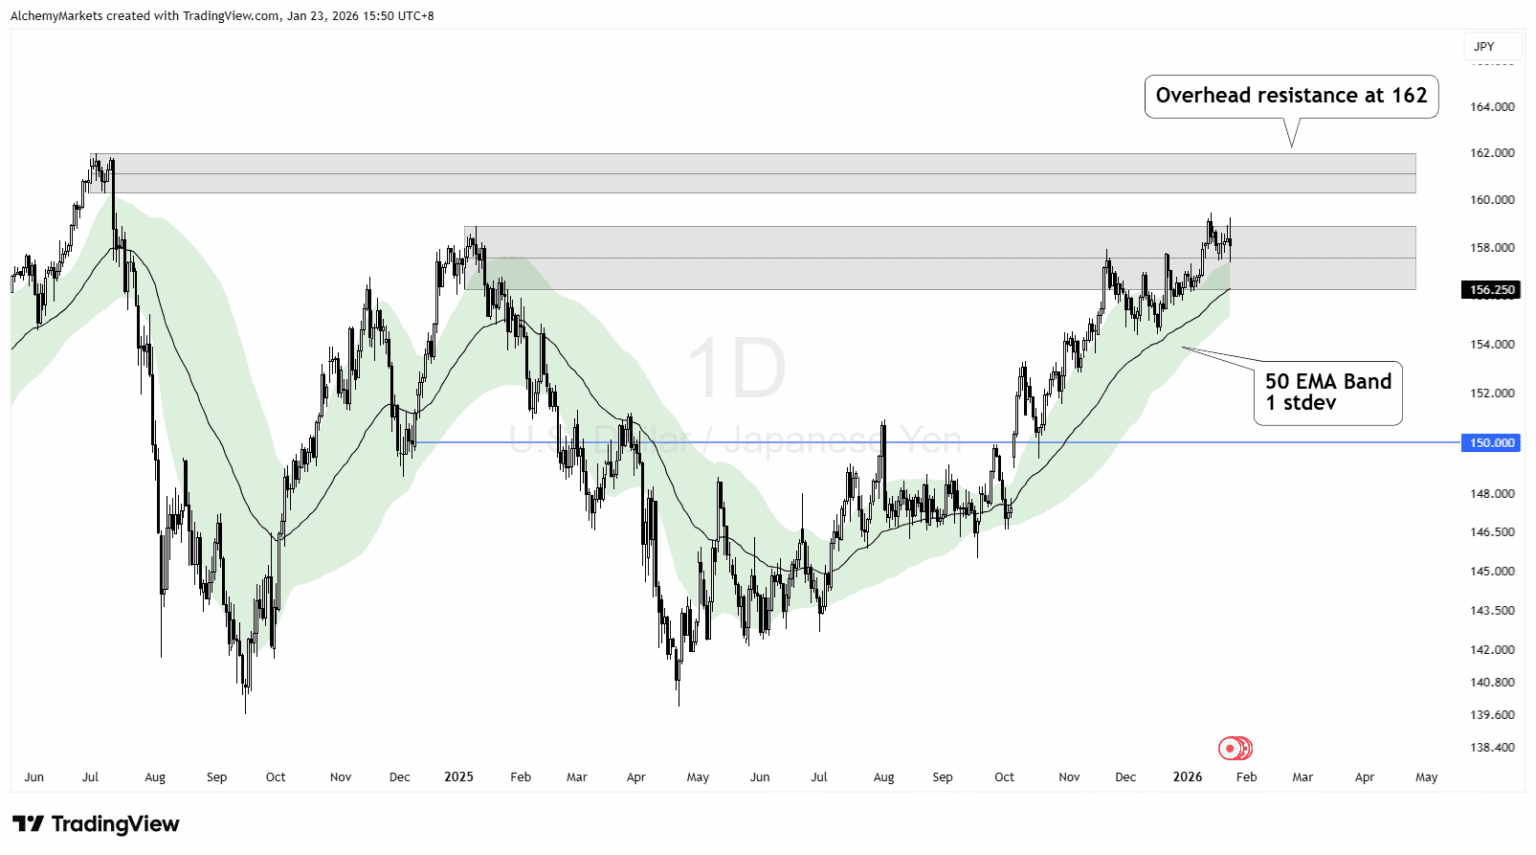
USD/JPY – Testing a key inflection zone
The yen has steadied even as Japanese politics remain noisy. With long-dated Japanese yields rising and US yields treading water, rate differentials are no longer widening.
USDJPY has pulled back from its spike toward 162, a zone that previously triggered intervention chatter, and is now consolidating between 157 and 161.
From here:
- A close above 159 could invite renewed upside momentum.
- The next resistance zone sits near 162.
- Price may simply range and grind along the 50-EMA band.
- Holding above the mid-158s keeps the broader trend constructive.
- A break below that area would signal momentum fatigue and open 155–156.
The takeaway: USDJPY remains a macro barometer. Holding near 160 suggests carry flows are still in play. Failure would point toward a more balanced, less directional regime.
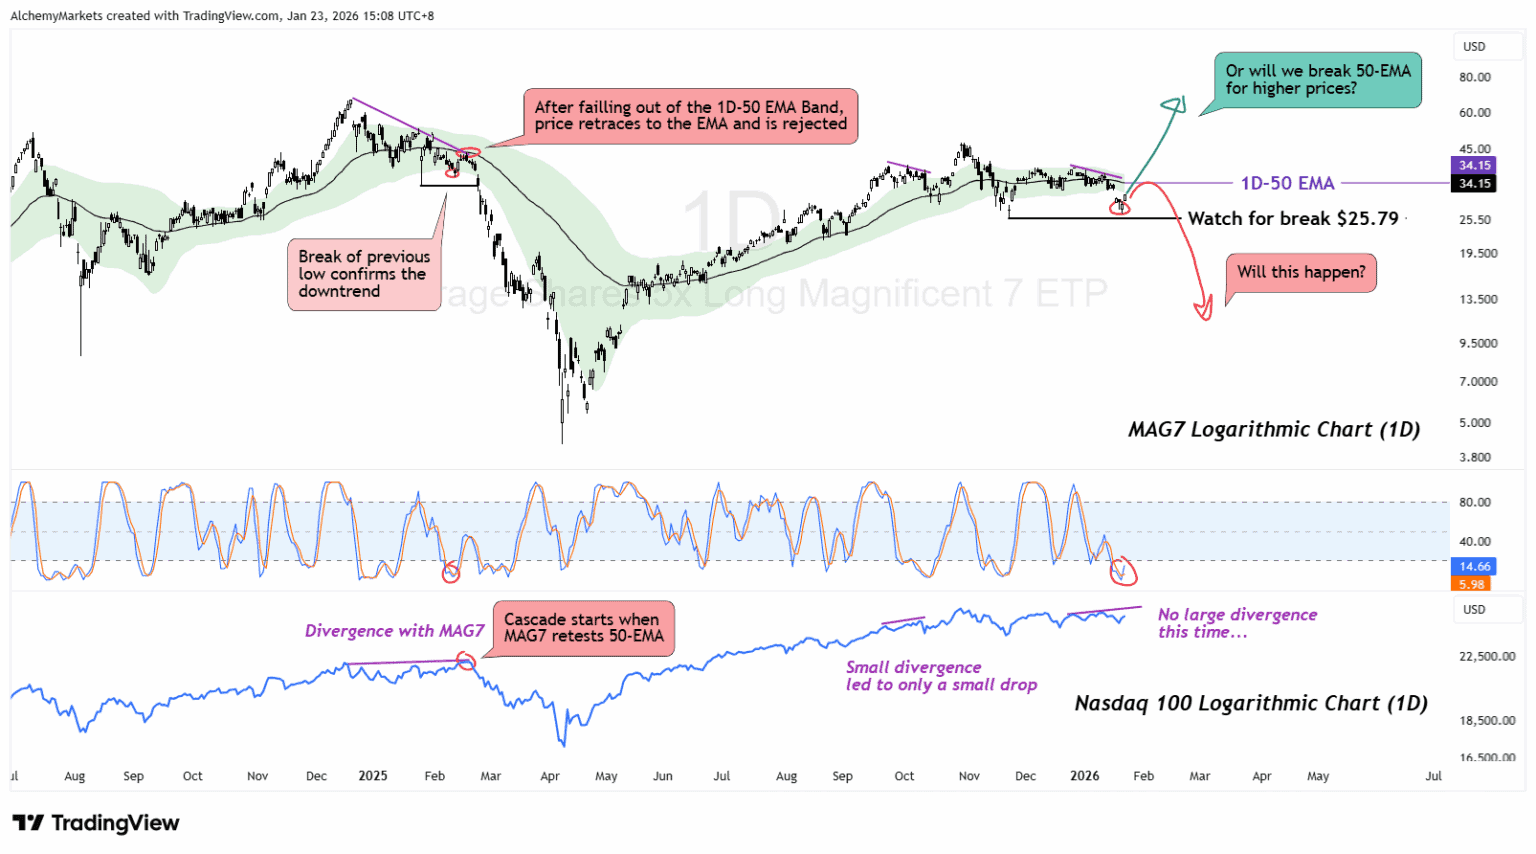
Nasdaq and the magnificent seven — Leadership fraying
The Magnificent 7 accounts for roughly 38% of the Nasdaq’s weight, so when it starts to lose momentum, that bleeds into the Nasdaq. Lately, that leadership has been slipping, and the Nasdaq has felt the drag.
Current price action: The MAG7 index has repeatedly failed to reclaim its 50-day EMA, and price recently slipped below the band with Stochastic RSI dipping into oversold territory. This has caused the Nasdaq to fall towards $24,945, breaking its previous low at ~25K.
This is where things get interesting.
Peel your eyes to the price action of MAG7 and Nasdaq in December 2024 (on the left of the chart).
Back then, MAG7 dipped below the 50-EMA band, retraced back into the EMA, and then was perfectly rejected at that level. That failure triggered a sharper downside move, pulling the Nasdaq lower with it.
A similar situation could happen here as we literally have the setup of:
- MAG7 dips below its 1D EMA-50 band.
- MAG7 is currently retracing, and below the 1D EMA-50.
A confirmation of this signal would be a break below the prior low at $25.79, after a retest of the 50-EMA. This would mirror the post-retest structure we saw in 2024.
There is an important difference this time around, though. The divergence between the Nasdaq and MAG7 is much smaller than it was back then. That reduces the immediate downside risk, but it also makes this retrace more important to watch.
If MAG7 can break and close back above the 50-EMA, pressure on the Nasdaq should ease. If it fails again, leadership loss remains a headwind and keeps the broader index vulnerable to further rotation-driven weakness.
What traders should watch next
The next key data point is December PCE on February 20. Another steady print would support the idea that inflation is cooling gradually. A move back toward 3% (currently 2.8%) would put yields back in focus, as rate holds become even more prolonged.
Before that, the January 27–28 FOMC meeting takes centre stage. A hold is expected, but the tone matters. Any hint of mid-year cuts could ease rate pressure, while a more cautious message would push yields higher.
In FX, USDJPY remains a clear signal. The 162 level is the line to watch. A break higher would suggest carry trades are back in control. Failure there would point to further compression in rate differentials.
Finally, watch market breadth of MAG7 vs the Nasdaq. Continued outperformance from small caps versus megacap tech would reinforce the ongoing rotation rather than signal a broader risk-off move.
Author

Zorrays Junaid
Alchemy Markets
Zorrays Junaid has extensive combined experience in the financial markets as a portfolio manager and trading coach. More recently, he is an Analyst with Alchemy Markets, and has contributed to DailyFX and Elliott Wave Forecast in the past.


