|

Copper: very early stages of a new downwards trend

Copper (Spot)

TECHNICAL ANALYSIS

Copper

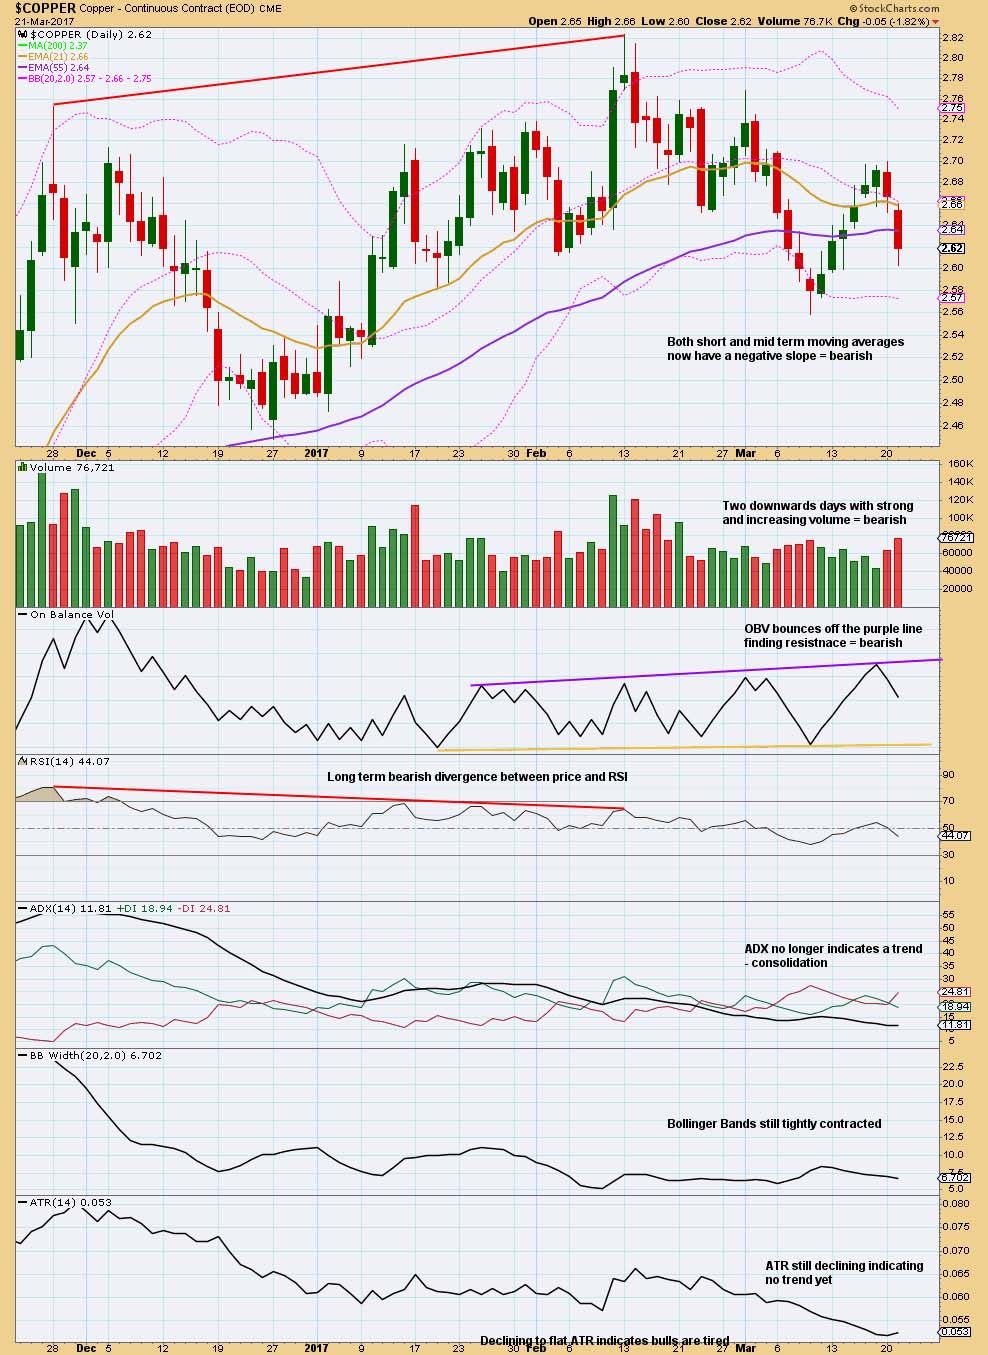
The first movement downwards from the high on the 13th of February to the low of the 23rd of February was choppy and overlapping and came on overall declining volume. The market fell of its own weight.

The bounce up to the 1st of March came with some increase in volume. The volume profile looks slightly bullish up to this point, but not strongly.

The fall to the last low on the 9th of March came with increasing volume. This looks clearly bearish.

The next bounce to the high of the 20th of March came with clearly declining volume. This looks like a counter trend movement within a new downwards trend.

ADX has not yet indicated a downwards trend. It is below 15 although it is rising slightly today and the -DX line is above the +DX line.

Contracting Bollinger Bands and declining ATR suggest the market is not yet trending.

The most bearish part of this chart is the recent volume profile. Other indicators suggest caution for short positions.

ELLIOTT WAVE ANALYSIS

Copper

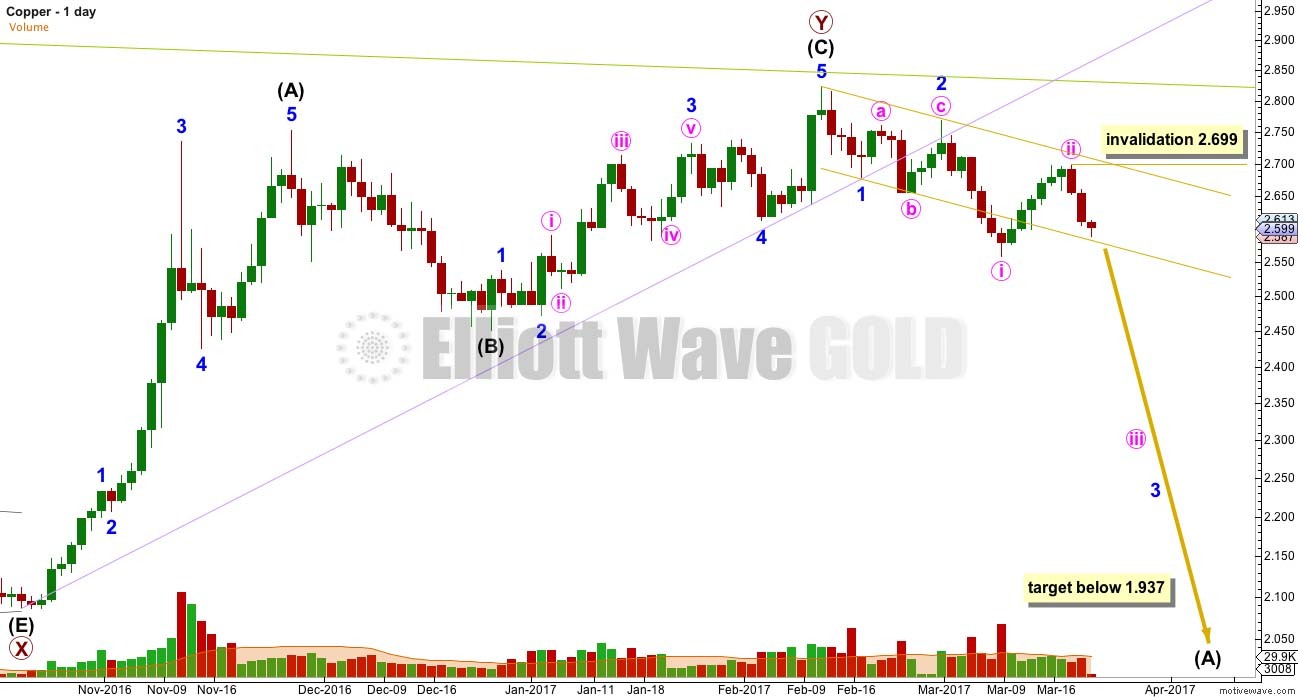
Copper may be in the very early stages of a new downwards trend. The green trend line goes back to August 2011 and has recently provided resistance. A!er price breached the lower edge of the lilac line, it then turned up to find resistance at that line for a typical throwback. The gold channel is a base channel about minor waves 1 and 2. The upper edge has provided resistance for another second wave correction. The lower edge may now be providing some support. If this Elliott wave count is correct, then Copper should break below support at the lower edge of this channel. It may then turn upwards for a test of resistance before moving down and away.


Become a Successful Trader and Master Elliott Wave like a Pro. Start your Free 14 Day Trial at - Elliott Wave Forecast.

Author

Elliott Wave Forecast Team

Elliott Wave Forecast Team

ElliottWave-Forecast.com

More from Elliott Wave Forecast Team
Share:

Editor's Picks

EUR/USD holds steady above 1.1850 in quiet session

EUR/USD stays defensive but holds 1.1850 amid quiet markets in the European hours on Monday.  The US Dollar is struggling for direction due to thin liquidity conditions as US markets are closed in observance of Presidents' Day holiday. 

GBP/USD flat lines near 1.3650 ahead of UK and US data

GBP/USD kicks off a new week on a subdued note and oscillates in a narrow range near 1.3650 on Monday. The mixed fundamental backdrop warrants some caution for aggressive traders as the market focus now shifts to this week's important data releases from the UK and the US.

Gold corrects lower, tries to stabilize above $5,000

Gold started the week under bearish pressure and declined to the $4,960 area before staging a modest rebound. As trading volumes remain thin with the US financial markets remaining closed on Presidents' Day holiday, XAU/USD looks to stabilize above $5,000 ahead of this week's key data releases.

Bitcoin consolidates as on-chain data show mixed signals

Bitcoin price has consolidated between $65,700 and $72,000 over the past nine days, with no clear directional bias. US-listed spot ETFs recorded a $359.91 million weekly outflow, marking the fourth consecutive week of withdrawals.

The week ahead: Key inflation readings and why the AI trade could be overdone

It is likely to be a quiet start to the week, with US markets closed on Monday for Presidents Day. European markets are higher across the board and gold is clinging to the $5,000 level after the tamer than expected CPI report in the US reduced haven flows to precious metals.

Monero Price Forecast: XMR risks a drop below $300 under mounting bearish pressure

Monero (XMR) starts the week under pressure, recording a 4% decline at press time on Monday after a 7% drop the previous day, putting the $300 support zone in focus.