Copper Futures (HG_F) Elliott Wave forecast: Mapping the path ahead

In this technical article, we’ll look at the Copper Futures (HG_F) Elliott Wave charts published in our members’ area. As our members know, Copper is forming an Elliott Wave Zigzag pattern within the cycle that started at the 6.7885 high. After identifying five waves down from that peak, we expected another five-wave move lower. Let’s break down the Elliott Wave structure and explain how we forecasted the path ahead.
HG_F Elliott Wave one-hour chart 10.21.2026
Copper has formed a clear five-wave decline within the cycle from the 6.788 peak, followed by a three-wave bounce. This is a textbook example of an Elliott Wave Zigzag pattern in progress. This structure suggests the correction is incomplete, and we should see another leg lower in five waves.
We count wave (b) blue completed at the 6.647 high. As long as the price stays below this level, we expect the decline to continue. We calculate the target by measuring equal legs, where wave (c) equals wave (a), using the Fibonacci extension tool. This gives us a target area of 6.383–6.320 for the cycle to complete.
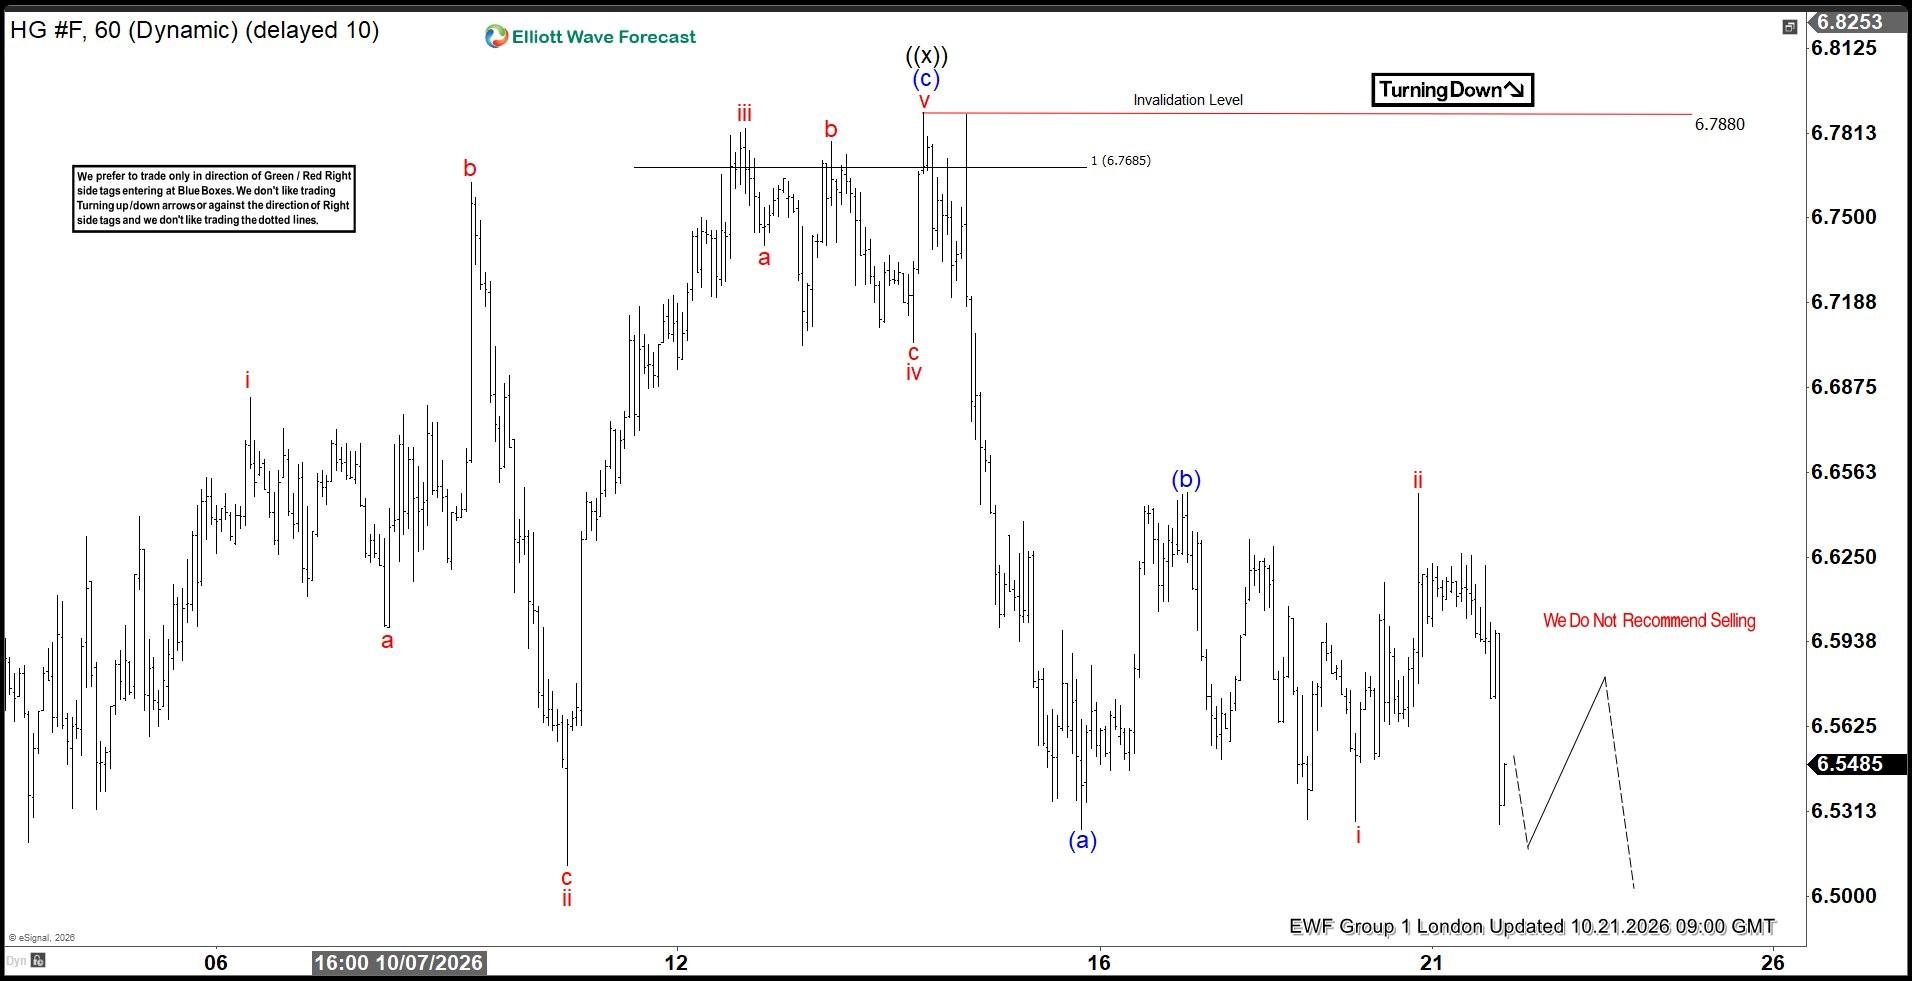
HG_F Elliott Wave one-hour chart 10.21.2026
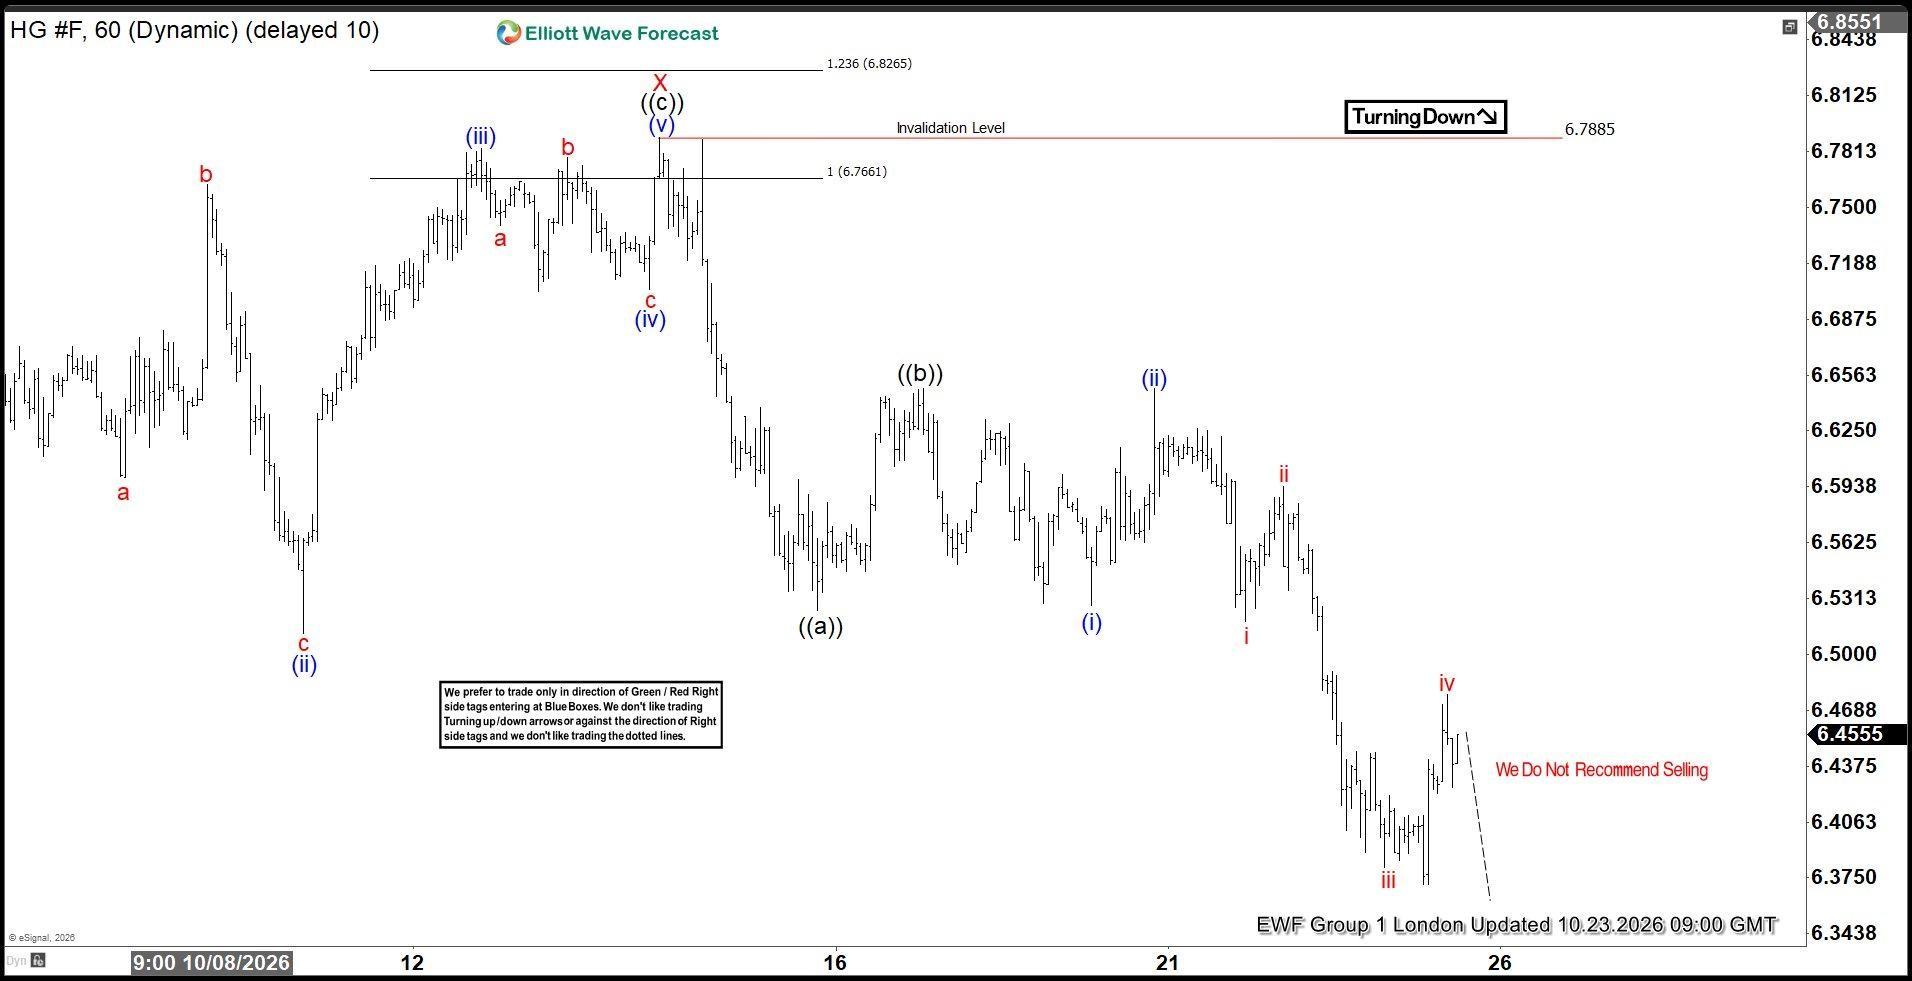
The commodity continues to trade lower, as forecasted. The current view suggests that another low would be ideal to complete the pattern. However, the target area of 6.383–6.320 has already been reached, so another low may or may not occur.
Author

Elliott Wave Forecast Team
ElliottWave-Forecast.com