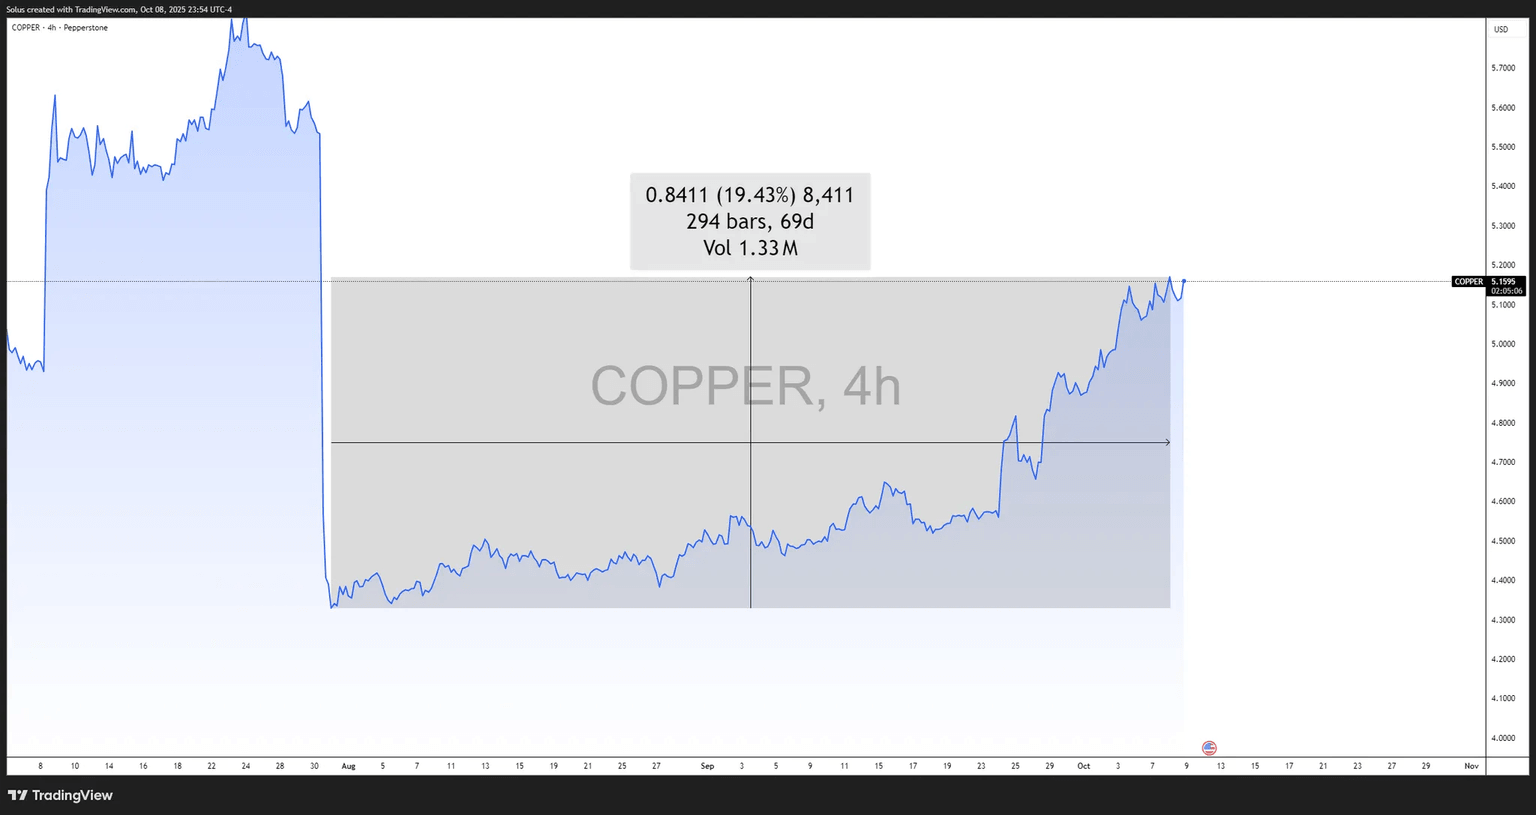
Copper breakout – Bulls reclaim July crash zone — $5.35 target in sight [Video]
- Copper extends its October climb, buoyed by ICSG’s 2026 deficit forecast and steady demand from EVs and grid infrastructure.
- Micro dislocations fade as LME–COMEX parity and tightening inventories add structural support.
- Technically, bulls defend the $5.00–$5.05 base, keeping upside momentum alive toward $5.20–$5.35/lb if growth sentiment stays constructive.
![Copper breakout – Bulls reclaim July crash zone — $5.35 target in sight [Video]](https://editorial.fxsstatic.com/images/i/copper-02_XtraLarge.jpg)
Macro narrative: From doubt to determination

Copper’s resilience since August reflects a quiet macro inflection: the global narrative flipped from “cautious slowdown” to “measured optimism.”
China’s targeted stimulus and easier central bank tone globally have encouraged traders to price in 2025 growth stabilization rather than contraction. Even as manufacturing PMIs remain soft, copper’s ability to hold the $10,000/t handle through August–September signaled that the market was leaning toward recovery, not collapse.
The shift became tangible after the International Copper Study Group projected a refined deficit by 2026, trimming 2025 mine-growth expectations. That announcement catalyzed a rotation of capital back into cyclical metals, with copper outperforming aluminum and nickel over the past month.
Micro structure tightens: Supply edges toward deficit
The once-distorted LME–COMEX arbitrage that spiked mid-year normalized through Q3, eliminating noise that had capped bullish follow-through earlier in 2024.
Meanwhile, warehouse stocks remain near multi-month lows, and large miners such as Teck and Anglo have recently revised production lower in Chile and Peru - two of the most supply-critical regions globally.
Taken together, the micro backdrop aligns with a “buy-the-dip” environment: dips near $10,000/t or $5/lb continue attracting long interest from funds positioned for the electrification cycle.
Copper vs Gold/Silver: Growth vs hedge
Copper isn’t a replacement for gold or silver - it’s their opposite.
- Copper = Growth Beta: thrives on stimulus, EV expansion, and infrastructure.
- Gold/Silver = Policy Hedge: outperform on falling real yields or macro shocks.
For traders, copper expresses the risk-on leg of the macro barbell, while gold and silver remain the defensive counterpart. Watching the copper/gold ratio helps gauge global risk appetite: it has been climbing again since early September - confirming the market’s tilt back toward cyclical optimism.
Technical outlook: Copper holds the high ground
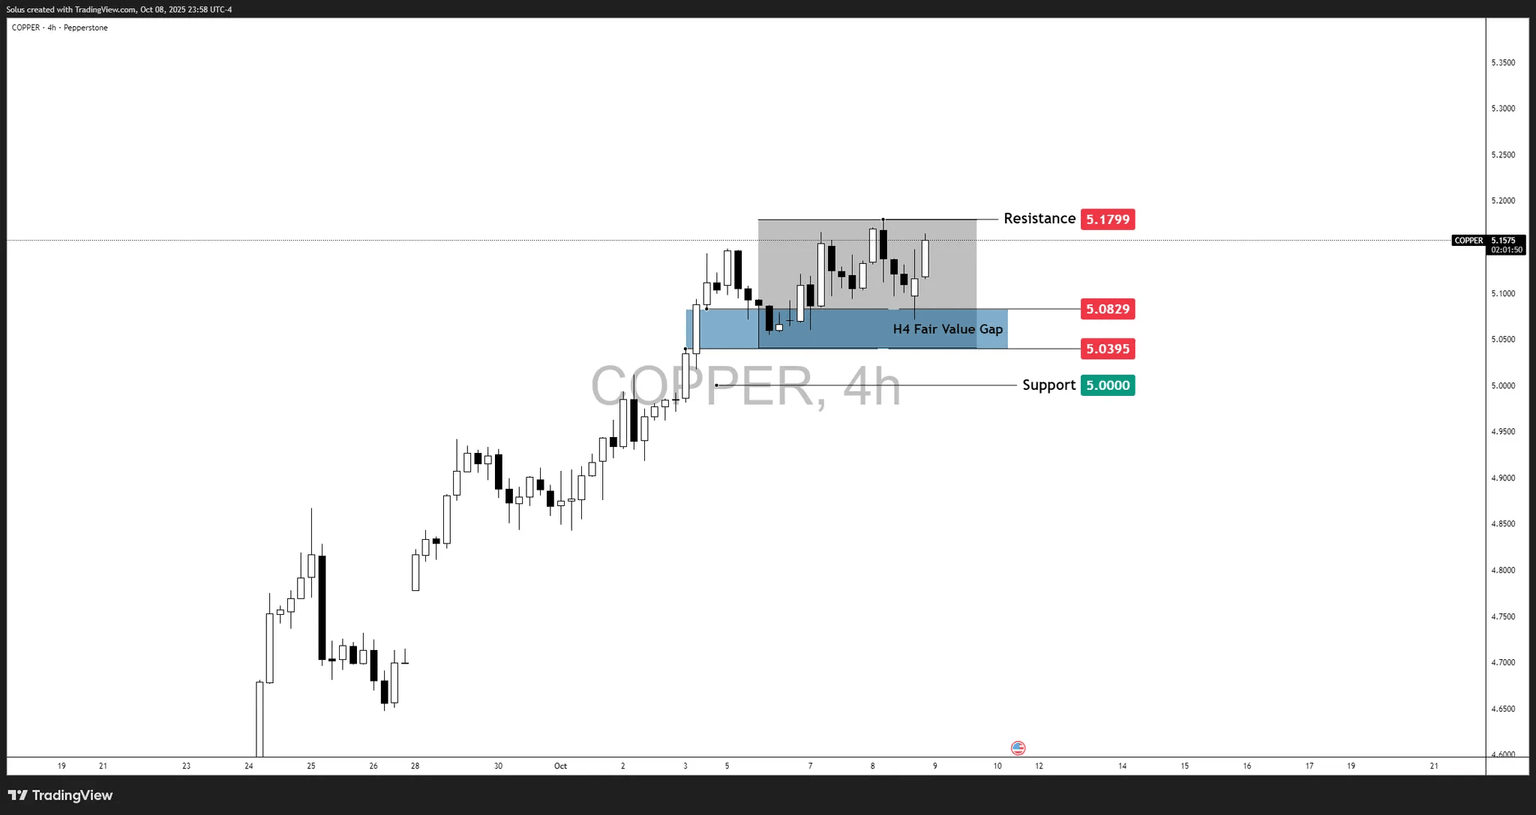
Copper’s 4-hour structure now paints a classic accumulation range within an ongoing uptrend, with price oscillating between a defined resistance at $5.1799 and a support shelf at $5.0000.
This range is anchored by an active H4 Fair Value Gap (FVG) between $5.0395–$5.0829, which has repeatedly acted as a reaccumulation zone throughout October.
The sequence of higher highs and higher lows since late September remains intact. Price continues to respect the FVG as an internal liquidity pocket, suggesting that institutional order flow is defending this zone. Until this FVG is violated, the overall market tone remains constructively bullish.
Bullish scenario: FVG defense and breakout continuation
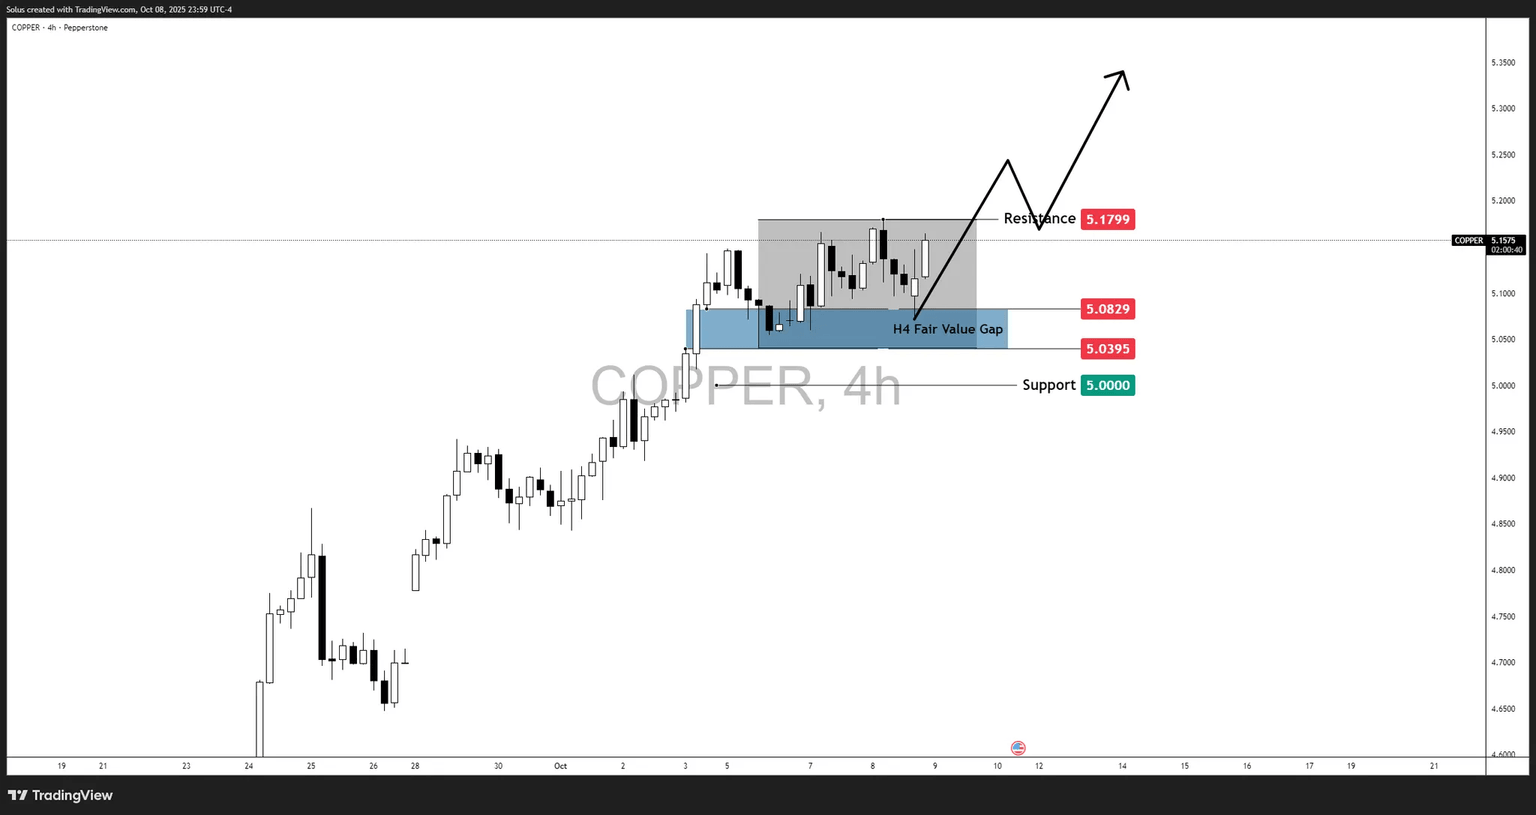
Bulls will look for price to retest and hold above the H4 FVG ($5.0395–$5.0829), confirming fresh absorption of liquidity.
- A clean 4-hour close above $5.1799 would mark a breakout from the current compression, opening a path toward $5.2500–$5.3500/lb (the next measured range projection).
- Continuation is favored if macro sentiment (China stabilization + softer USD) remains supportive.
Key bullish triggers
- Rejection wicks within the FVG followed by bullish engulfing close.
- DXY weakness or dovish post-FOMC commentary.
- Inventories trending lower or fresh mine output downgrades.
Bearish scenario: Breakdown through $5.00 support
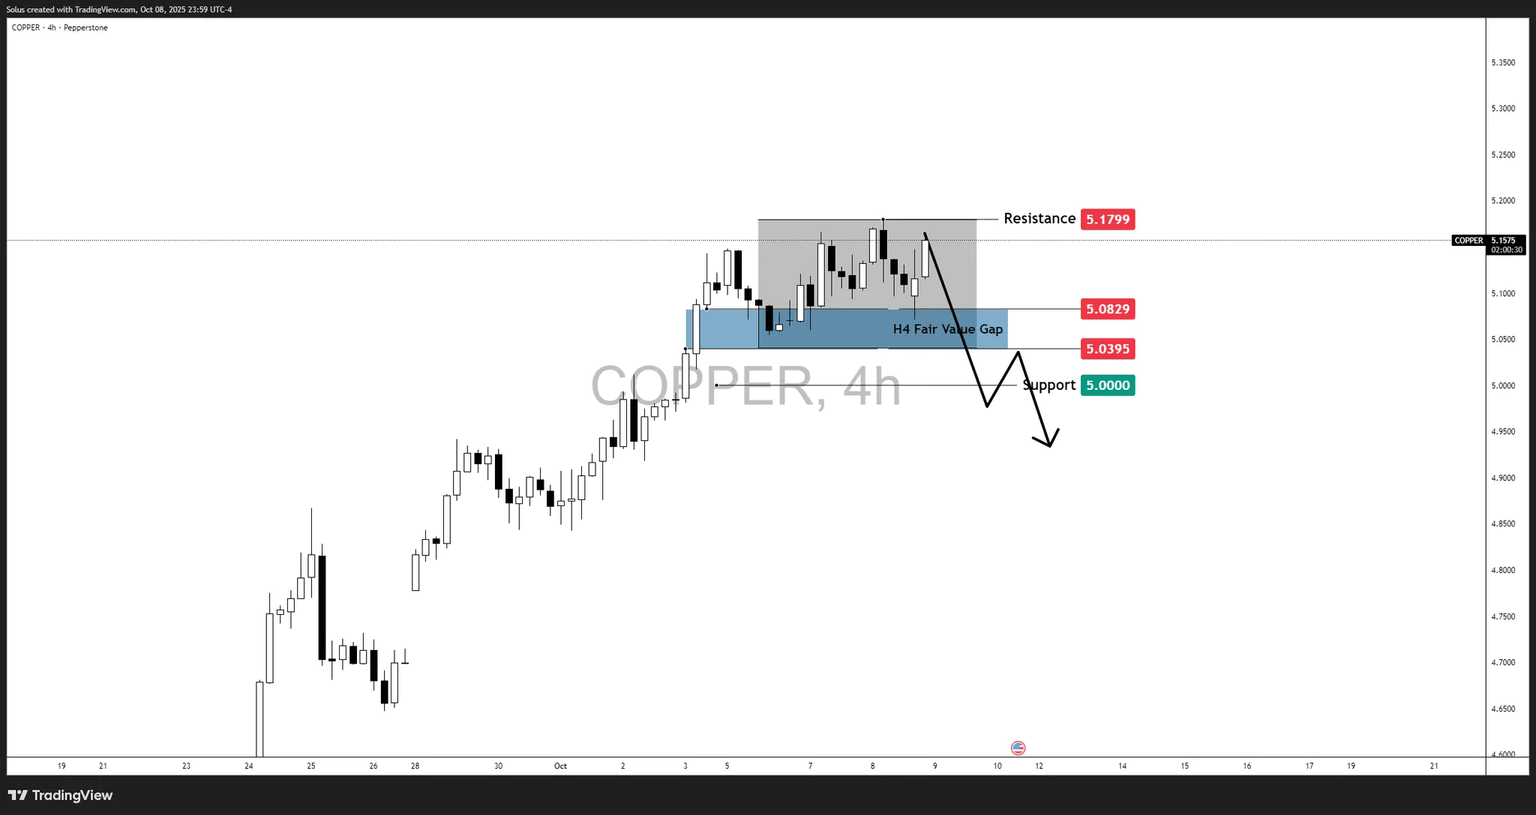
A decisive break below $5.0000 would invalidate the current accumulation pattern and signal a short-term correction.
- Such a move could target the $4.9500–$4.9000 zone, filling unmitigated imbalances from late September’s breakout leg.
- However, as long as daily structure holds above $4.8500, the larger bullish macro narrative (2026 deficit + EV/grid demand) remains unchallenged.
Bearish triggers:
- Sustained closes below $5.00 with expanding volume.
- Stronger USD or risk-off rotation following US data beats.
- Chinese industrial indicators slipping back into contraction.
Final thoughts: Copper holds its ground as it reclaims the July 30 sell-off
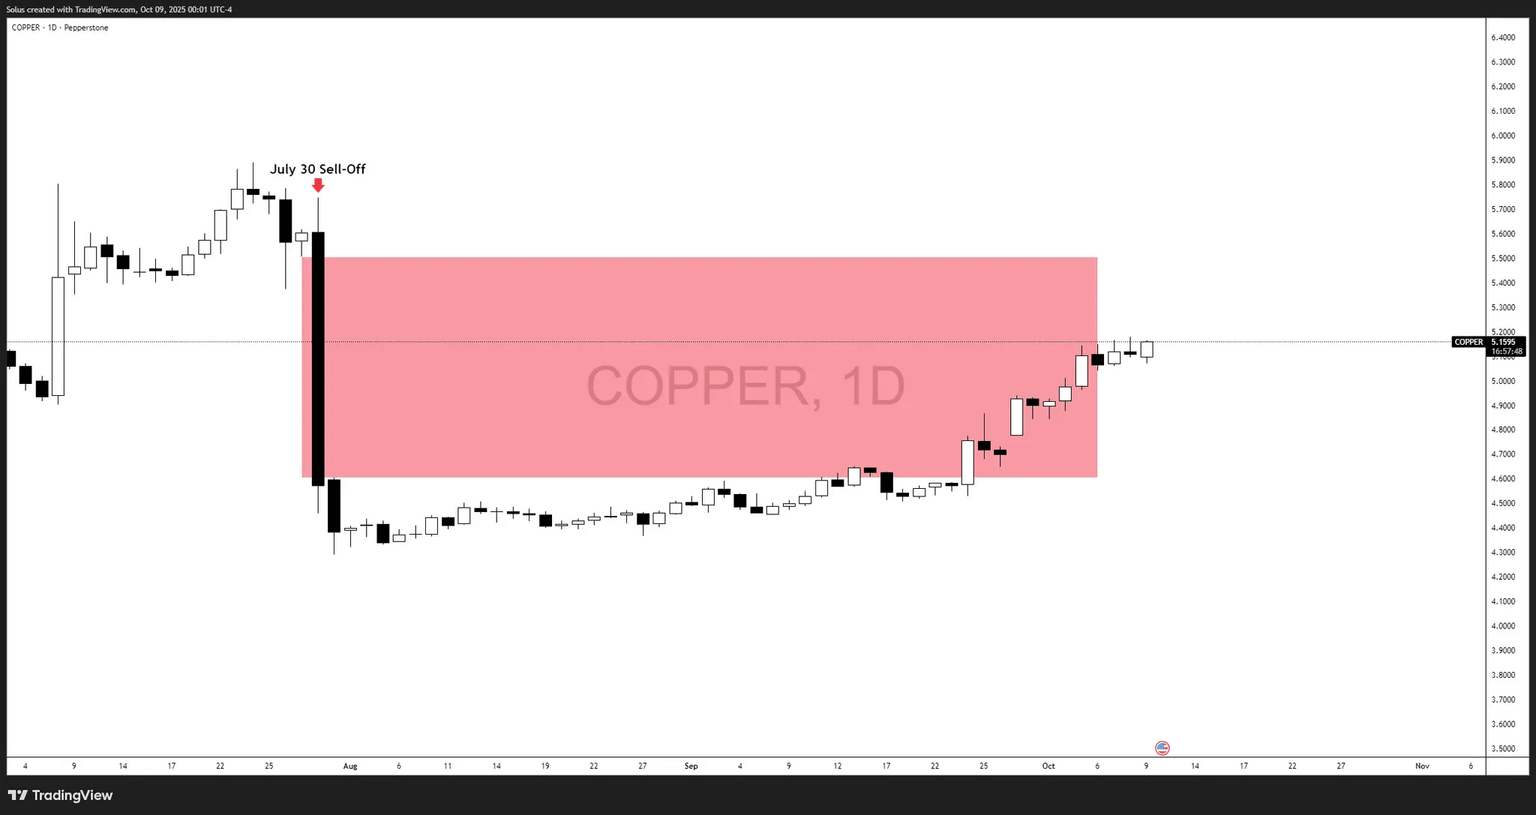
Big picture - copper is standing strong.
After months of accumulation, the market is now reclaiming the entire July 30 sell-off range, a region that previously capped bullish attempts during Q3.
The reclaim signifies structural repair and renewed institutional participation in the metal.
This behavior aligns perfectly with the ongoing 2026 deficit narrative and the global electrification cycle.
While short-term volatility may persist around $5.00–$5.18, the overall trend remains constructive and underpinned by real-world demand.
Unless the macro backdrop deteriorates sharply, copper’s story is not one of exhaustion - it’s one of resilience and revival.
Author

Jasper Osita
ACY Securities
Jasper has been in the markets since 2019 trading currencies, indices and commodities like Gold. His approach in the market is heavily accompanied by technical analysis, trading Smart Money Concepts (SMC) with fundamentals in mind.


