Commencing Phase One of US-China Trade Deal

After President Trump and Chinese Vice Premier Liu He meet today, they have announced that “Phase One” of a trade deal has been reached, however it will take up to five weeks to get the deal in writing. The deal includes intellectual property, financial services, currency and foreign exchange issues, and big agricultural purchases. Tariffs the were to begin on Tuesday have been canceled. Will markets be disappointed because this isn’t a complete deal? Will this be considered “kicking the can down the road”? Or will the markets be happy that Phase 1 was reached, which opens the door to Phase 2 further down the road? We’ll know once all the details are sliced and diced over the weekend.
DXY broke lower out of a rising wedge on a daily time frame. That move continued today as DXY is down 37 on the day and halted at the 78.6% retracement from the September 13th lows to the October 1st highs.
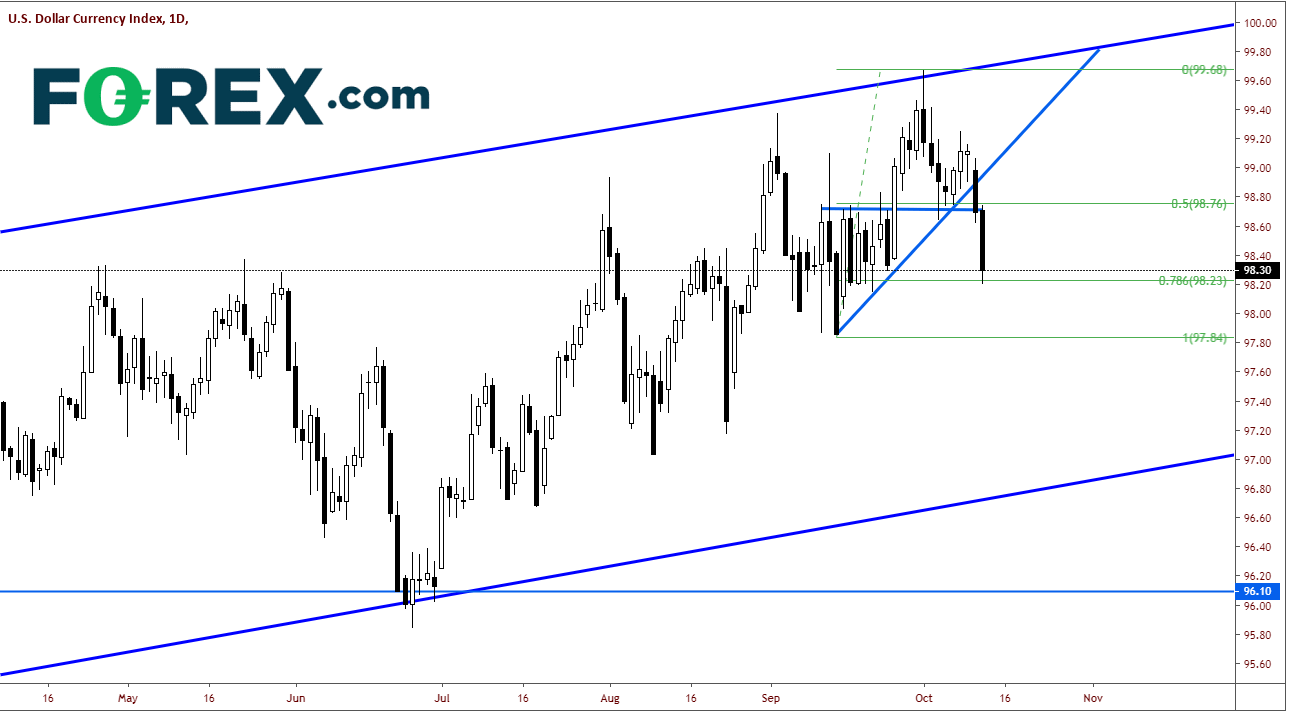
Source: Tradingview.com, FOREX.com
On a 240-min chart, price in the DXY reached the target for the flag pattern at 98.20 (98.15 was the actual target). Next support level is the September 13th lows at 97.86. Below that is horizontal resistance at 97.72 and we could have a very quick move down to the rising trendline on the daily chart near 97.00 . Resistance now comes in near yesterday’s low of 98.62, and then the breakdown level from the rising wedge (on the daily chart) and horizontal resistance (on the 240-minute chart) near 98.82. Note the RSI is oversold, which may indicate the US Dollar Index is ready for a short-term bounce.
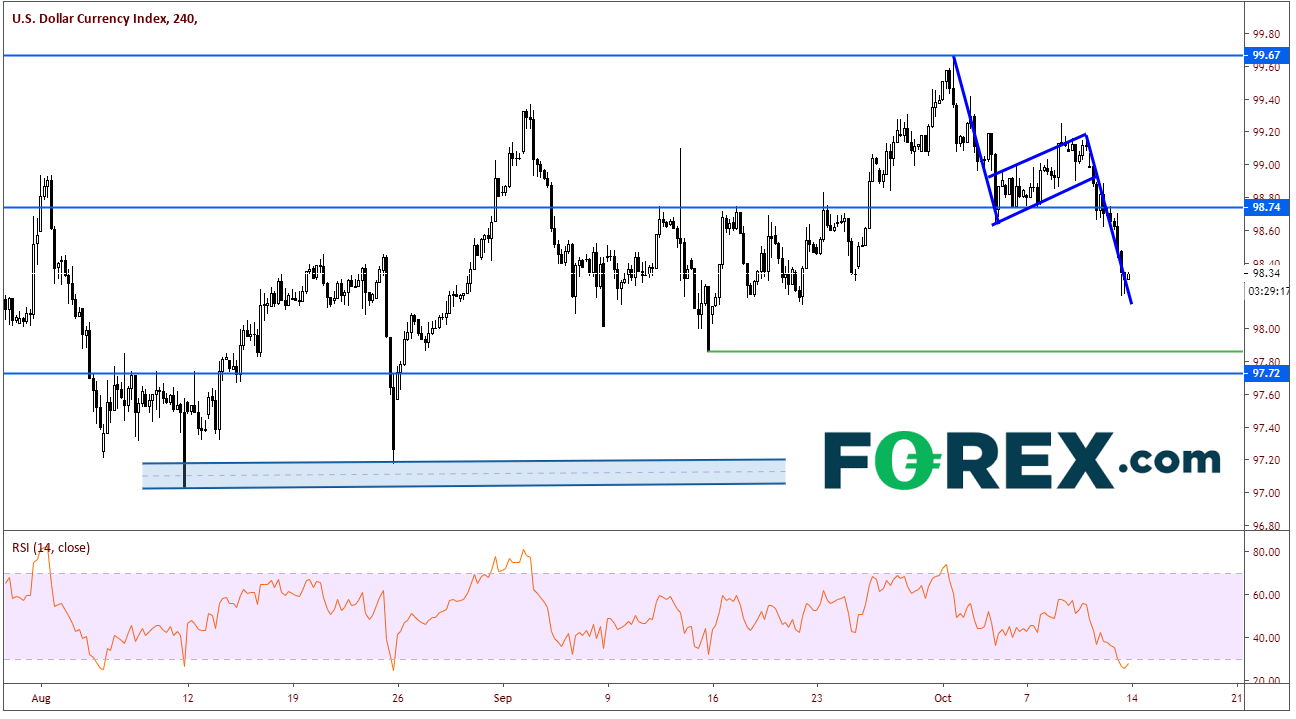
Source: Tradingview.com, FOREX.com
The risk on move today has led USD/JPY higher. The pair has done a great job of stopping out market participants who got short on the false breakdown of the triangle on a daily chart. As usual, if price has a false breakout to one side of a pattern, it often retests the other side, as was the case today. USD/JPY broke out of the top of the triangle pattern and is testing the recent double top near 108.50, which also happens to be the 50% Fibonacci retracement from the April 24th highs to the August 26th lows.
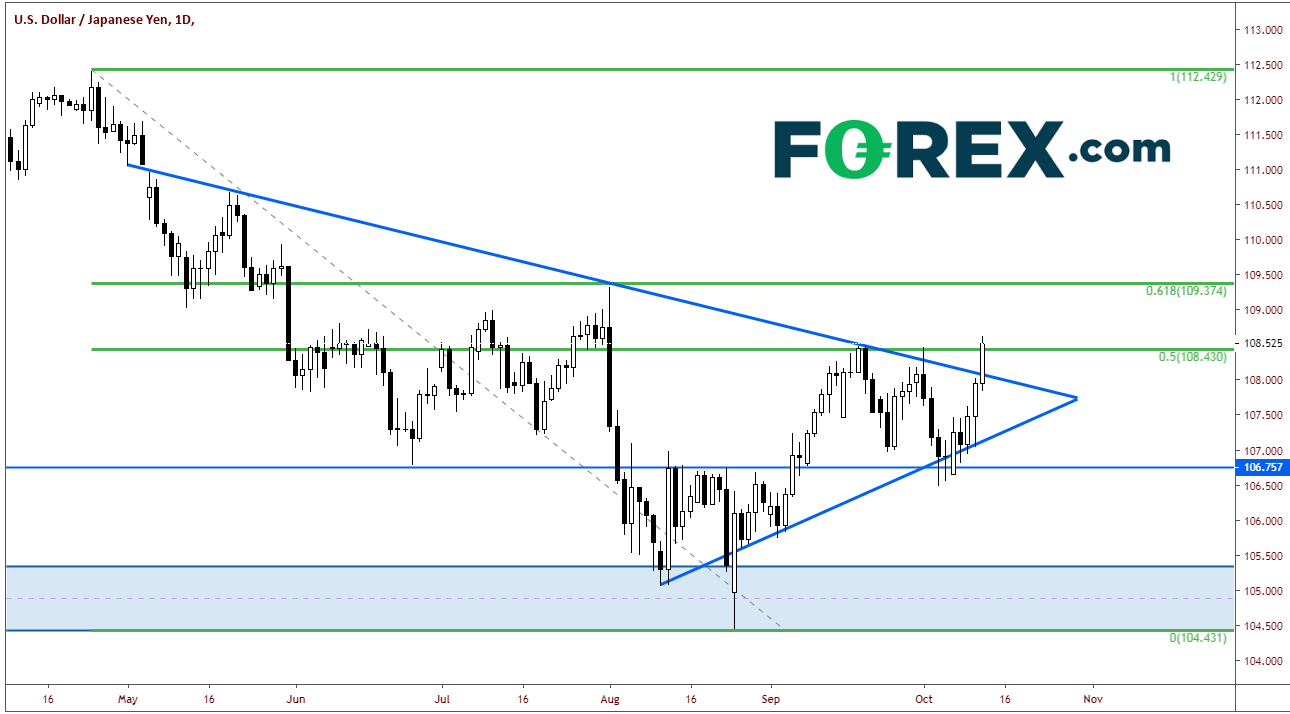
Source: Tradingview.com, FOREX.com
On a 240-minute chart, we can see more clearly how important the 108.50 level has been over the past few months. We can also see how USD/JPY, although breaking lower out of the triangle on a daily, held horizontal support and bounced. This could always be a triple top, if the 108.50 level holds, in which case the target would be near 105.00. However, a triple top cannot be confirmed until we break below prior lows. For now, first horizontal support is 107.75. If price breaks below there, a support zone comes into play between 106.75/107.00. Also note that the RSI on the 240-minute is in overbought territory and turning lower. Resistance comes in the 108.50 level and today’s highs just above at 108.62. Above there, the pair can trade up to the highs of August 1st, near 109.25.
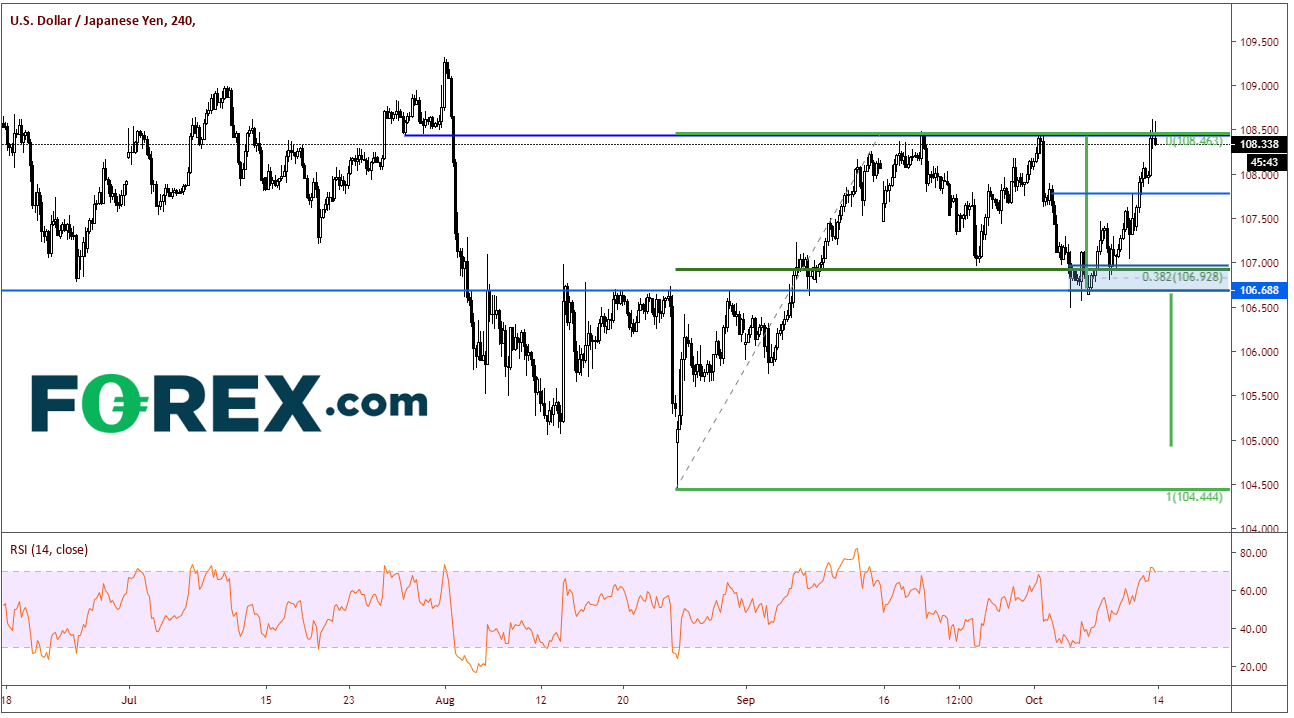
Source: Tradingview.com, FOREX.com
Author

Forex.com Team
Forex.com


