Technical analysis – Will the Coffee quotes continue to rise?
Coffee technical analysis summary
Buy Stop։ Above 225.
Stop Loss: Below 203.
| Indicator | Signal |
| RSI | Neutral |
| MACD | Buy |
| MA(200) | Buy |
| Fractals | Neutral |
| Parabolic SAR | Buy |
| Bollinger Bands | Neutral |
Coffee chart analysis
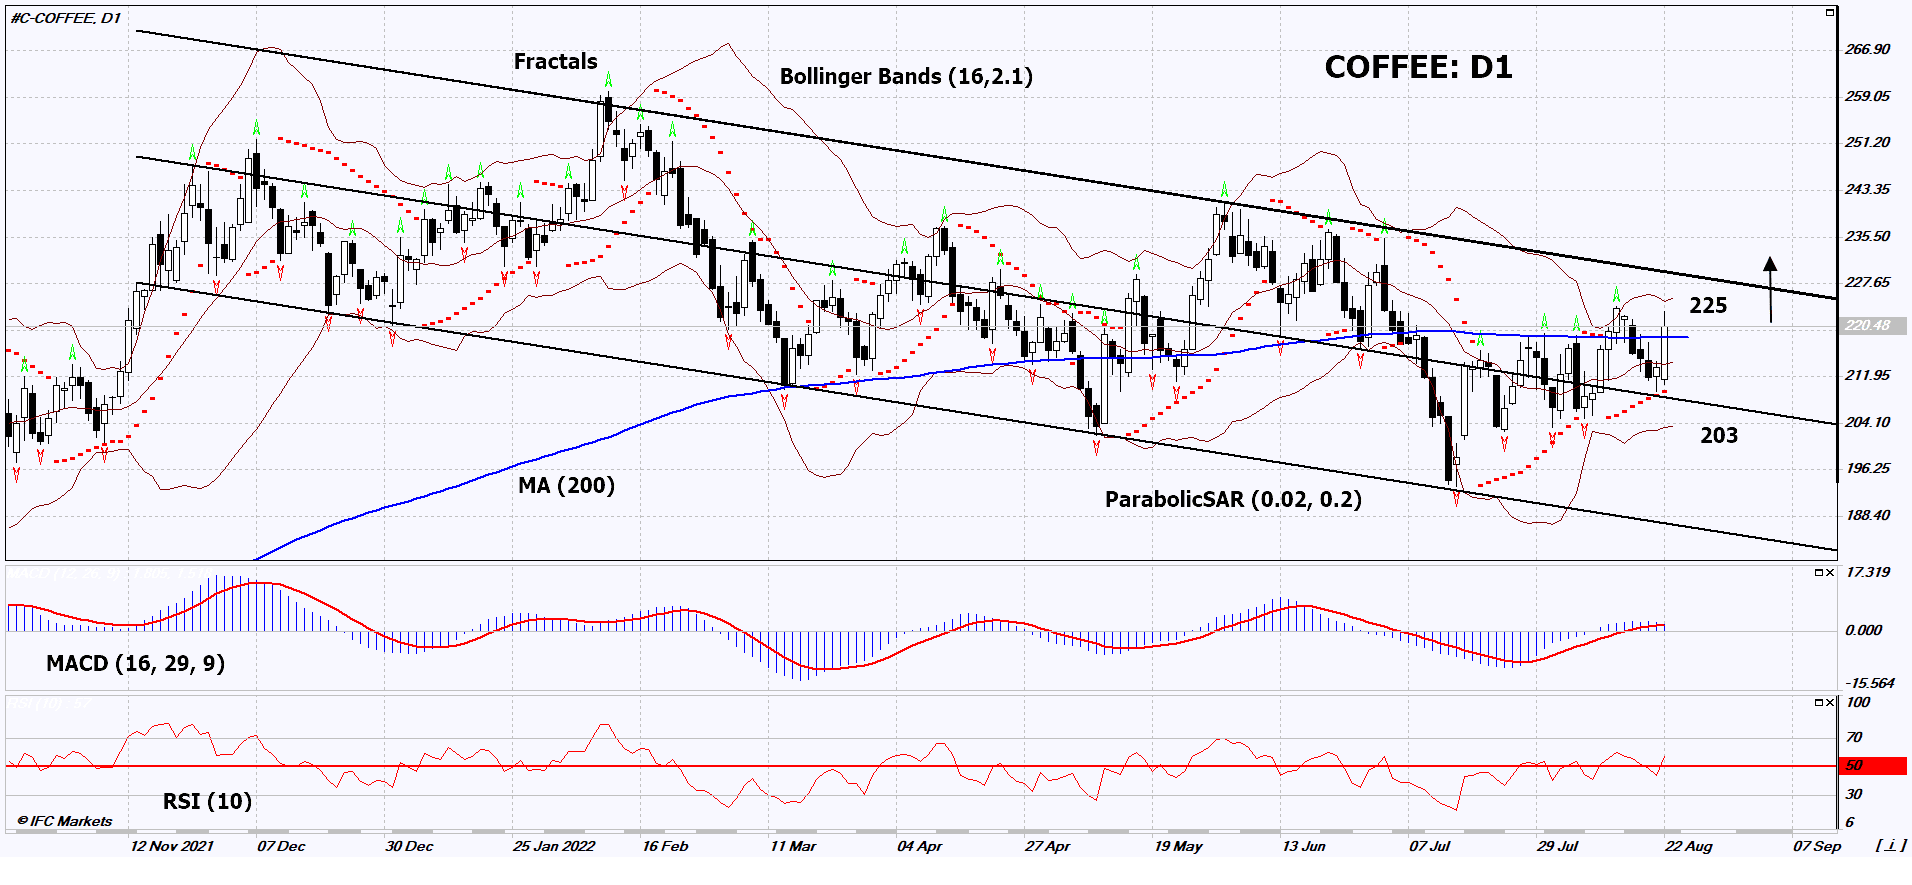
On the daily timeframe, COFFEE: D1 is growing towards the resistance line of the descending channel. It broke the 200-day moving average. A number of technical analysis indicators formed signals for further growth. We do not rule out a bullish movement if COFFEE: D1 rises above the last upper fractal and the upper Bollinger band: 225. This level can be used as an entry point. The initial risk limit is possible below the Parabolic signal, the last lower fractal, the 200-day moving average line and the lower Bollinger line: 203. After opening a pending order, we move the stop following the Bollinger and Parabolic signals to the next fractal low. Thus, we change the potential profit/loss ratio in our favor. The most cautious traders after making a trade can switch to a four-hour chart and set a stop loss, moving it in the direction of movement. If the price overcomes the stop level (203) without activating the order (225), it is recommended to delete the order: there are internal changes in the market that were not taken into account.
Fundamental analysis of commodities - Coffee
Drought in Brazil could have a negative impact on the coffee crop. Will the COFFEE quotes continue to rise?
The Somar Meteorologia agency reported no rain in the Brazilian state of Minas Gerais. It accounts for 30% of the arabica coffee crop. According to weather forecast channel Climatempo the drought will continue in Brazil until the end of August. Maxar Technologies does not exclude the lack of rain in South America until the end of the year due to the natural phenomenon La Nina. Earlier, Cecafe reported a 16% y/y decline in Brazilian coffee exports in July to 2.17 million bags.
Want to get more free analytics? Open Demo Account now to get daily news and analytical materials.
Want to get more free analytics? Open Demo Account now to get daily news and analytical materials.
Author

Dmitry Lukashov
IFC Markets
Dimtry Lukashov is the senior analyst of IFC Markets. He started his professional career in the financial market as a trader interested in stocks and obligations.


