China’s April slowdown highlights dilemma between growth and inflation

China's domestic activity data disappointed across the board in April, signalling a second-quarter slowdown. Weaker growth and rising inflation could complicate policymaking in the coming months.
Retail sales slumped to lowest level since 2022
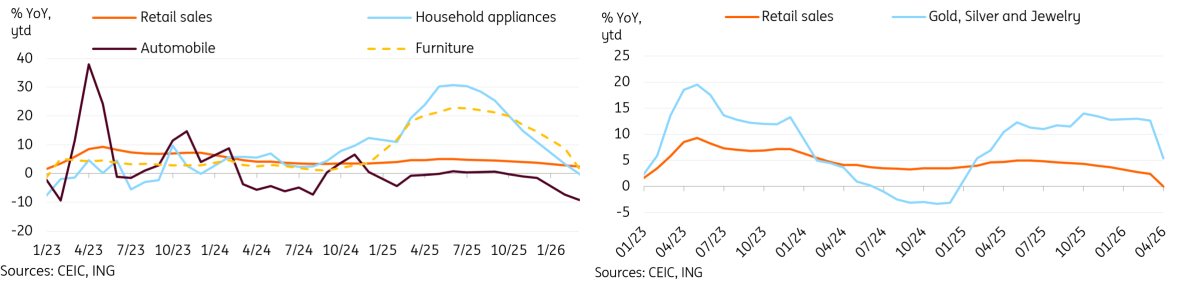
China’s retail sales slowed to just 0.2% year-on-year in April, down from 1.7%, coming in much worse than market forecasts for a modest acceleration. This was the slowest month of growth since 2022.
The weakness of retail sales was broad-based. There are two key themes for this month's data.
The first theme is that we're now paying the price for front-loaded demand from the trade-in policy, which we have been warning about since last year.
- Auto sales also continued to show signs of weakness, down -15.3% YoY. Replacement demand for vehicles purchased in previous years hasn't come in yet, and many prospective buyers have already made their purchases.
- Household appliances (-15.1%) and furniture (-10.4%), two of last year's major beneficiaries for the trade-in policies, are now deeply in contractionary territory.
The second theme concerns a pullback in gold prices following the outbreak of the Iran war. We saw a -21.3% YoY drop in gold and jewellery sales in April, as gold prices stabilised at lower levels -- after falling from record highs at the start of the year.
Outside of these themes, there were a few bright spots in the data. Consumer staples generally outperformed, with catering (2.2%), grains and oils (4.1%), beverages (3.6%), and alcohol and tobacco (11.7%) all outperforming headline growth. Apparel (3.6%) and cosmetics (4.7%) fared relatively well. However, these categories clearly weren't enough to salvage overall growth.
Trade-in policy headwind and falling gold prices drive April's retail sales miss
Industrial production unexpectedly slows despite export boom
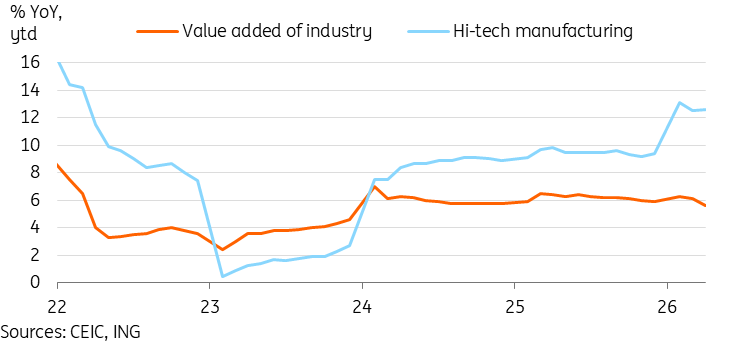
Industrial production slowed to 4.1% YoY in April, down from 5.7% in March. This also came in much lower than market expectations, registering a 33-month low.
The softness of industrial production was surprising, given the strong export data that we have been seeing in recent months. A look at the subcategories suggests that this export-driven momentum is still supporting the data, with auto (9.2%), rail, ships, and aeroplanes (8.2%), and computer, communication, and other electronic equipment manufacturing (15.6%) all well outperforming headline growth. Hi-tech manufacturing (12.8%) continues to fare well, with solid growth in both industrial (15.1%) and service robot (12.3%) production.
However, sluggish domestic activity is dragging many other categories. Real estate-related categories, such as cement (-10.8%), glass (-7.9%), and steel (-1.7%), were clear underperformers. We may also be seeing the impact of anti-involution policies, as solar cells declined -25.6% YoY in April amid a broader crackdown on overcapacity and excessive price competition.
The impact of the Iran War is also appearing in the data. Crude oil processing volume fell -5.8% YoY on the month. Electricity, heat, gas, and water production and supply bucked the broader trend, accelerating to 5.3% YoY in April.
Industrial production slumped in April despite continued strength in export related categories
Fixed asset investment cratered back into negative territory
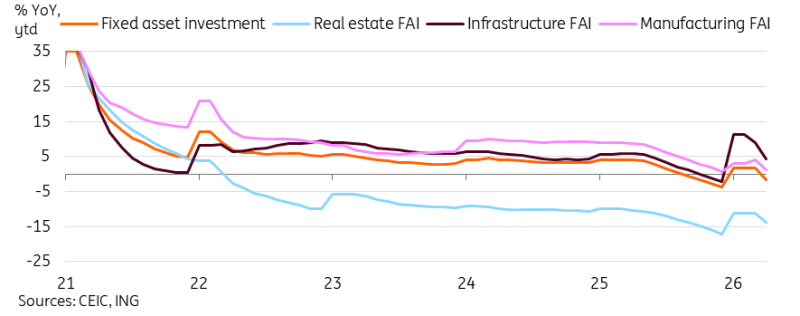
China's fixed asset investment saw a steep drop to -1.6% YoY year-to-date in the first four months of the year. This was much weaker than market forecasts largely looking for a stable or slightly weaker growth level. This was a steep drop from 1.7% YoY in the first quarter. It suggests a steep drop-off of investment in April as geopolitical uncertainty may have weighed on investment decisions.
Looking at the subcategories, there wasn't much to take away in terms of silver linings from April's data. We continued to see public investment at 2.5% YoY ytd outpace private investment, which fell to -5.2% YoY ytd, both sides saw a sharp drop in April.
Infrastructure FAI continued to decelerate, dropping to 4.3% YoY ytd after peaking at 11.4% YoY ytd in the first two months of the year. Manufacturing FAI slowed to 1.2% YoY ytd, dragged by pharmaceutical (-7.8%), specialised equipment (-6.0%), and auto (-0.5%) sectors. The exceptions included the rail, ships, and aeroplane sector (24.7%), and surprisingly, the textiles sector (12.1%).
Investment appetite has been very soft in the post-pandemic years. One element behind this is the impact of inflationary expectations. It at least is expected to turn around this year, though it will take some time before it's reflected in markets. The other element is persistent geopolitical uncertainty amid last year's trade war and this year's Iran war. Geopolitical uncertainty looks likely to remain a factor. There’s hope that, after Trump's visit to China and the announcement of a new constructive strategic stability framework, we could see less volatile China-US ties moving forward. This could create a better environment for investment.
FAI fell back into negative territory as investment appetite stays sluggish
Property prices fall at a slower pace as tier 1 cities see gains
China's National Bureau of Statistics released its 70-city sample of property prices for April. New home prices fell by -0.19% month-on-month, while used home prices dipped by -0.23%.
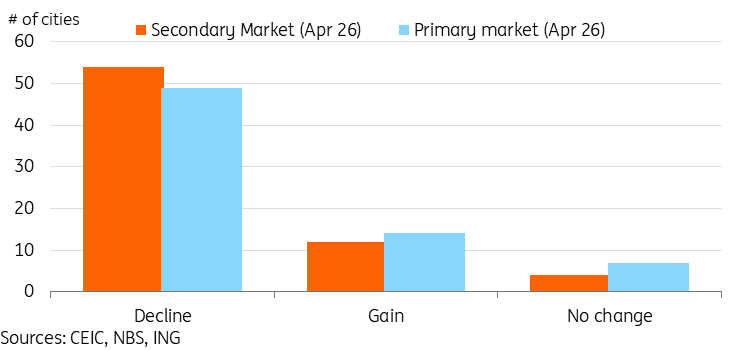
The city-level breakdown continued to show decent strength. In the primary market, 21 cities saw prices stabilise or rise in April (up from 16 in March), versus 16 in the secondary market (down slightly from 17 in March).
In particular, we saw encouraging upticks in Tier 1 cities' secondary market prices, with a strong 0.7% MoM pickup in Shanghai, followed by 0.4% MoM in Beijing, 0.3% MoM in Shenzhen, and 0.2% MoM in Guangzhou. We have argued over the previous years that a broader turnaround would need to start from tier 1 and tier 2 cities, while lower-tier cities could face a more prolonged decline.
The April data suggest we are closer to a bottom in the property market, though we've had a couple of false bottoms in the past as well. A stabilisation in prices is a much-needed first step toward a recovery, as inventories remain high. This would take time to work through before a recovery in investment could take hold. With property investment still down -13.7% YoY ytd, it's likely that the property sector will remain a major drag on growth this year, even if we do see prices bottom out.
More cities saw price gains or stabilisation in April
April data highlights dilemma between growth and inflation
Disappointing April economic activity suggests growth will decelerate in the second quarter, after the first quarter comfortably beat expectations. A strong first quarter and continued resilience in exports suggest that China remains on track to meet its growth targets. But the sharper-than-expected deterioration in April's data highlights downside risks and should be seen as a warning sign that additional stimulus might be needed to stabilise the domestic side of the economy.
On the other hand, we see signs that reflation momentum is strengthening in China. PPI inflation and non-food inflation just hit 45-month highs, with further price pressures likely still ahead. Luckily for China, this rising inflation backdrop stems from a near-deflationary environment over the past few years. Thus, the People’s Bank of China doesn't face the rate hike pressure that many global central banks are now facing.
Nonetheless, this combination of downside growth risks and upside inflation risks highlights the dilemma for policymakers. We've seen limited urgency for stimulus so far this year, but if data continue to deteriorate, this could change soon.
Author

ING Global Economics Team
ING Economic and Financial Analysis
From Trump to trade, FX to Brexit, ING’s global economists have it covered. Go to ING.com/THINK to stay a step ahead.