Ethereum Price Forecast: Investors remain on the sidelines

Ethereum price today: $1,910
- Ethereum distribution across key wallet cohorts saw negligible changes even as exchange flows remain weak.
- ETH ETFs show signs of improvement, but overall US sentiment remains subdued.
- ETH is on the verge of breaking above the major 100-day EMA resistance.
Ethereum (ETH) continued its consolidation pattern over the past week with several key on-chain and derivatives metrics indicating traders remain hesitant to return to the market.
The holdings across several wallet cohorts remained largely unchanged over the past week. Wallets holding 10K-100K ETH, also classified as whales, saw modest inflows of only 10K ETH. On the other hand, investors with a balance of 100-1K and 1K-10K ETH held steady with mild distributions of 50K ETH.
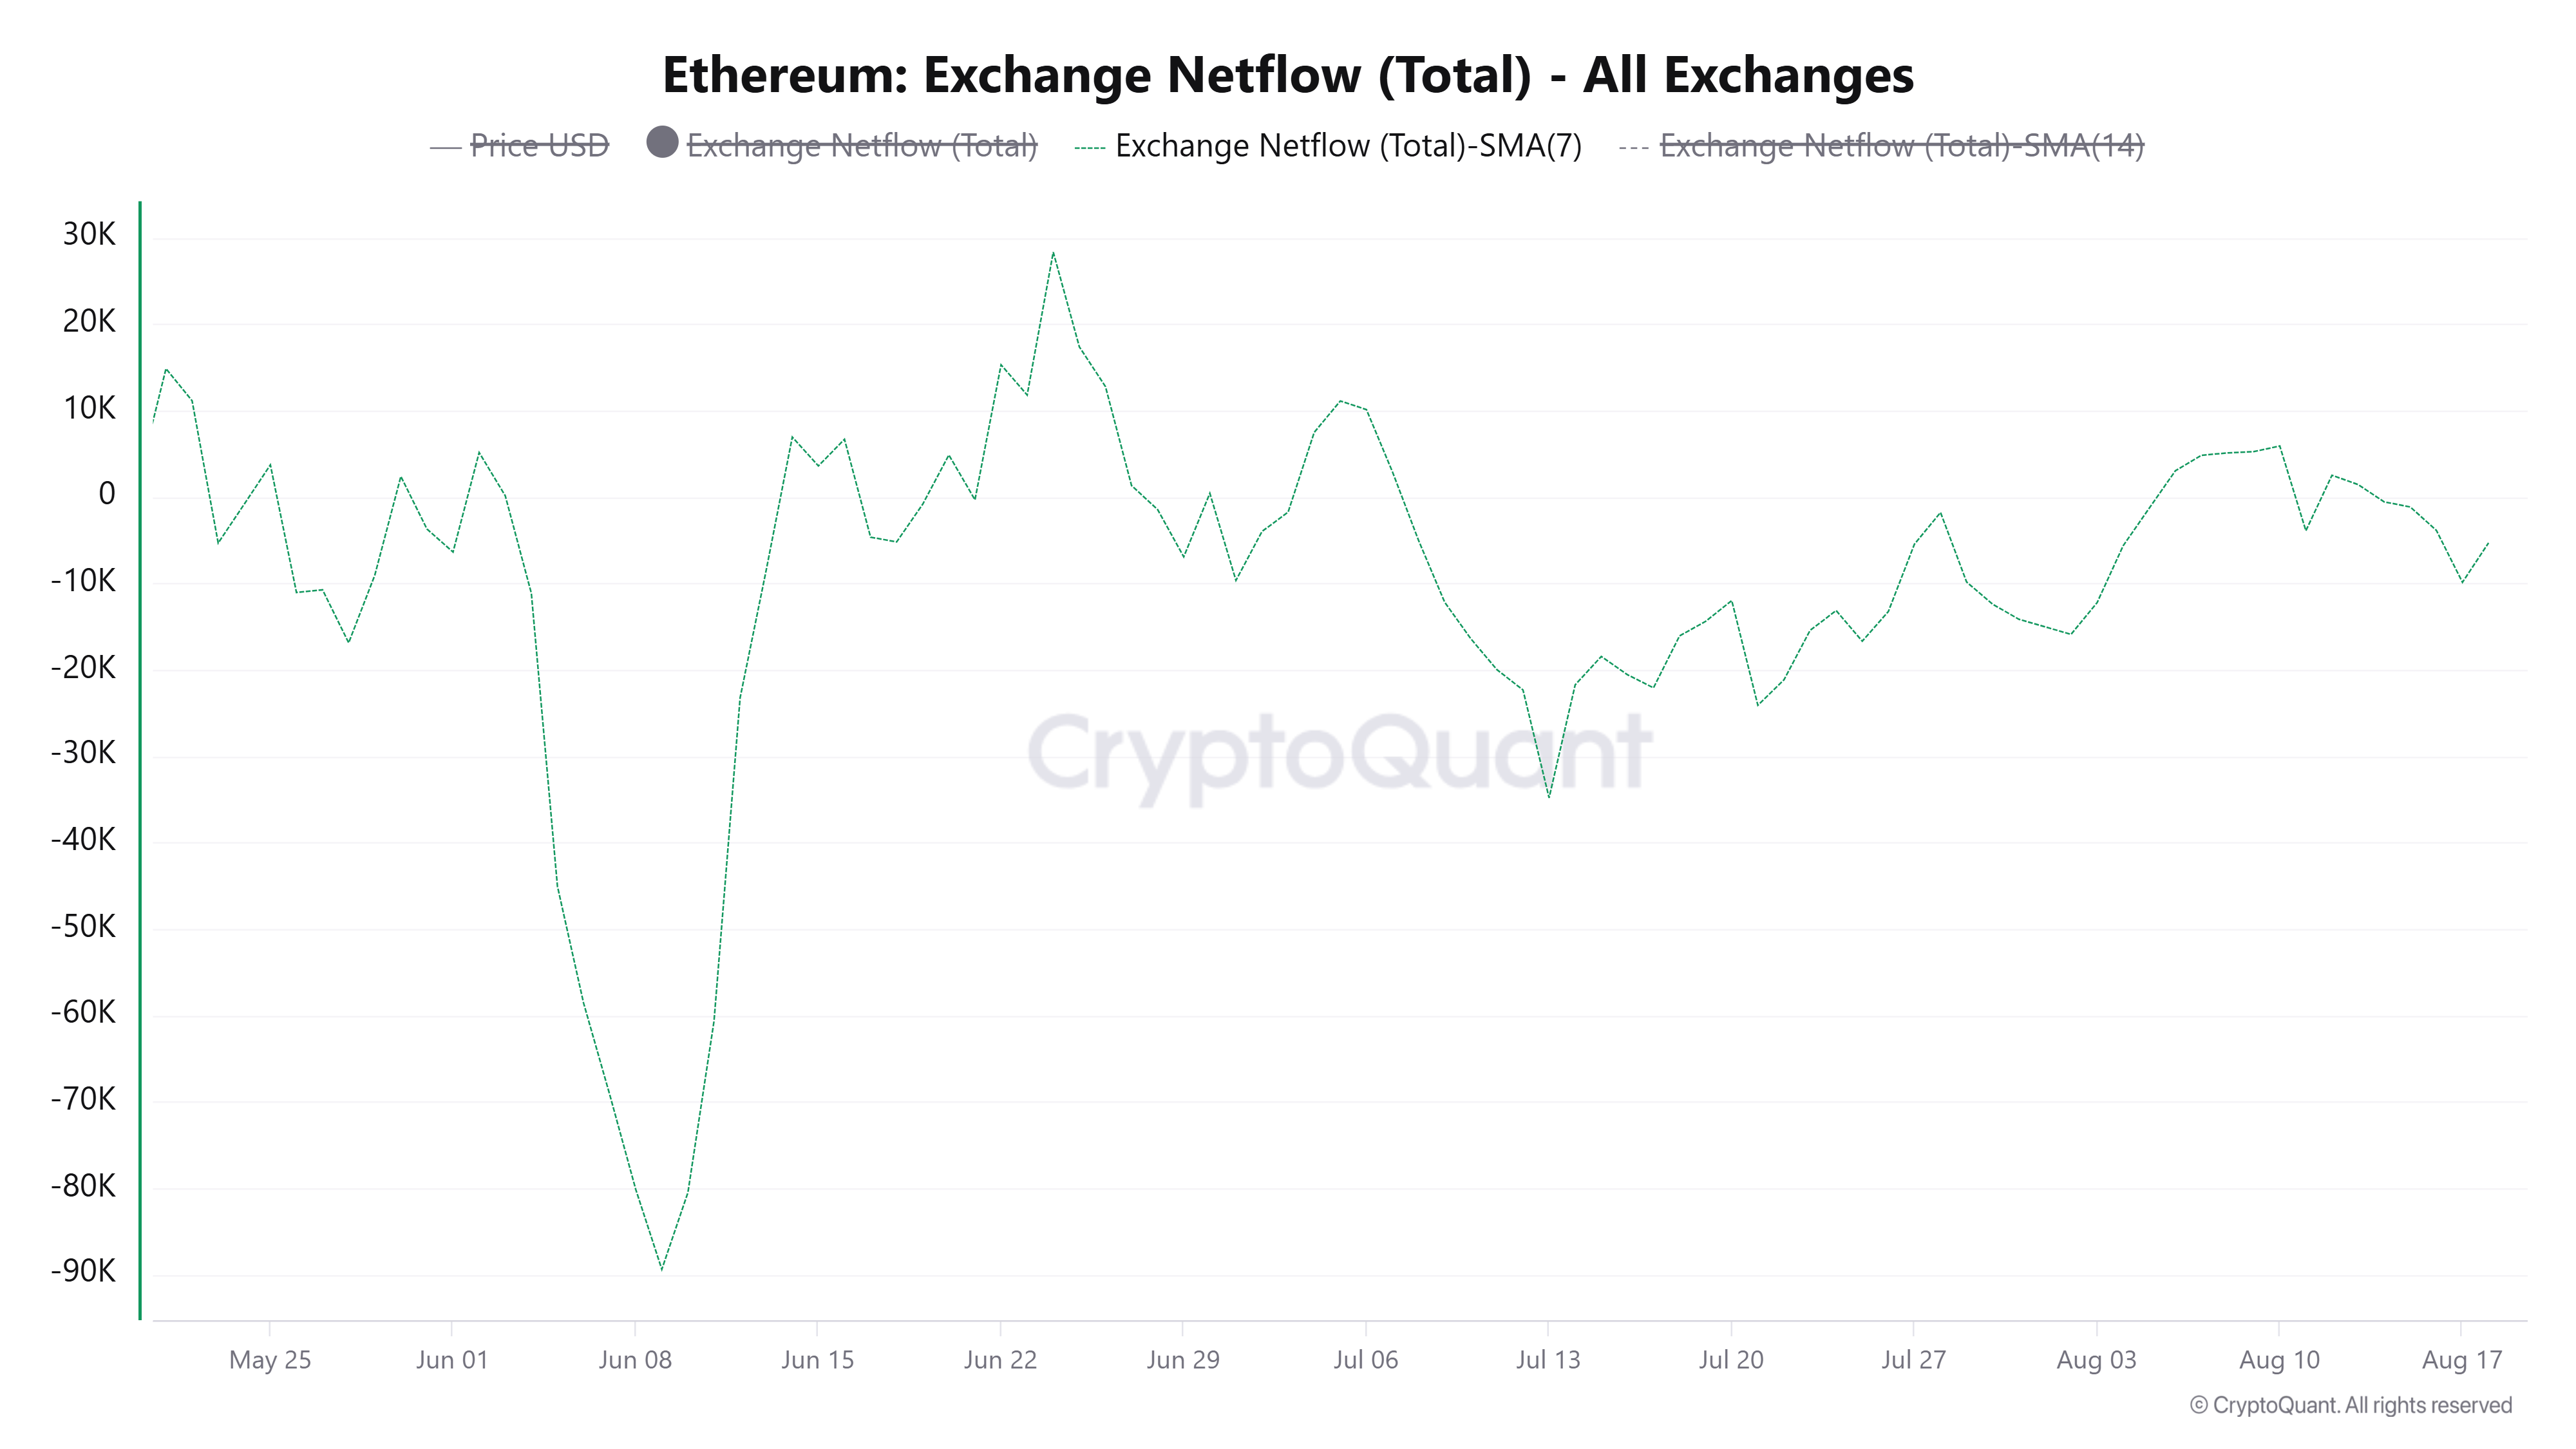
A similar move is evident in ETH exchange net flows, which measure the difference between coins flowing in and out of exchanges. After a slight rise earlier in the month, the metric posted a modest tilt below the zero line in the past week, indicating a lack of directional bias in the spot market.
Meanwhile, US spot ETH exchange-traded funds (ETFs) continue to show improvements, bouncing back from a tiny $2.26 million outflow last week, with $30.85 million in net inflows on Monday, per SoSoValue data. Before last week's performance, the products recorded five straight weeks of net inflows.
The move shows institutions are gradually returning, but at a slower pace than the outflows seen in the first half of the year.
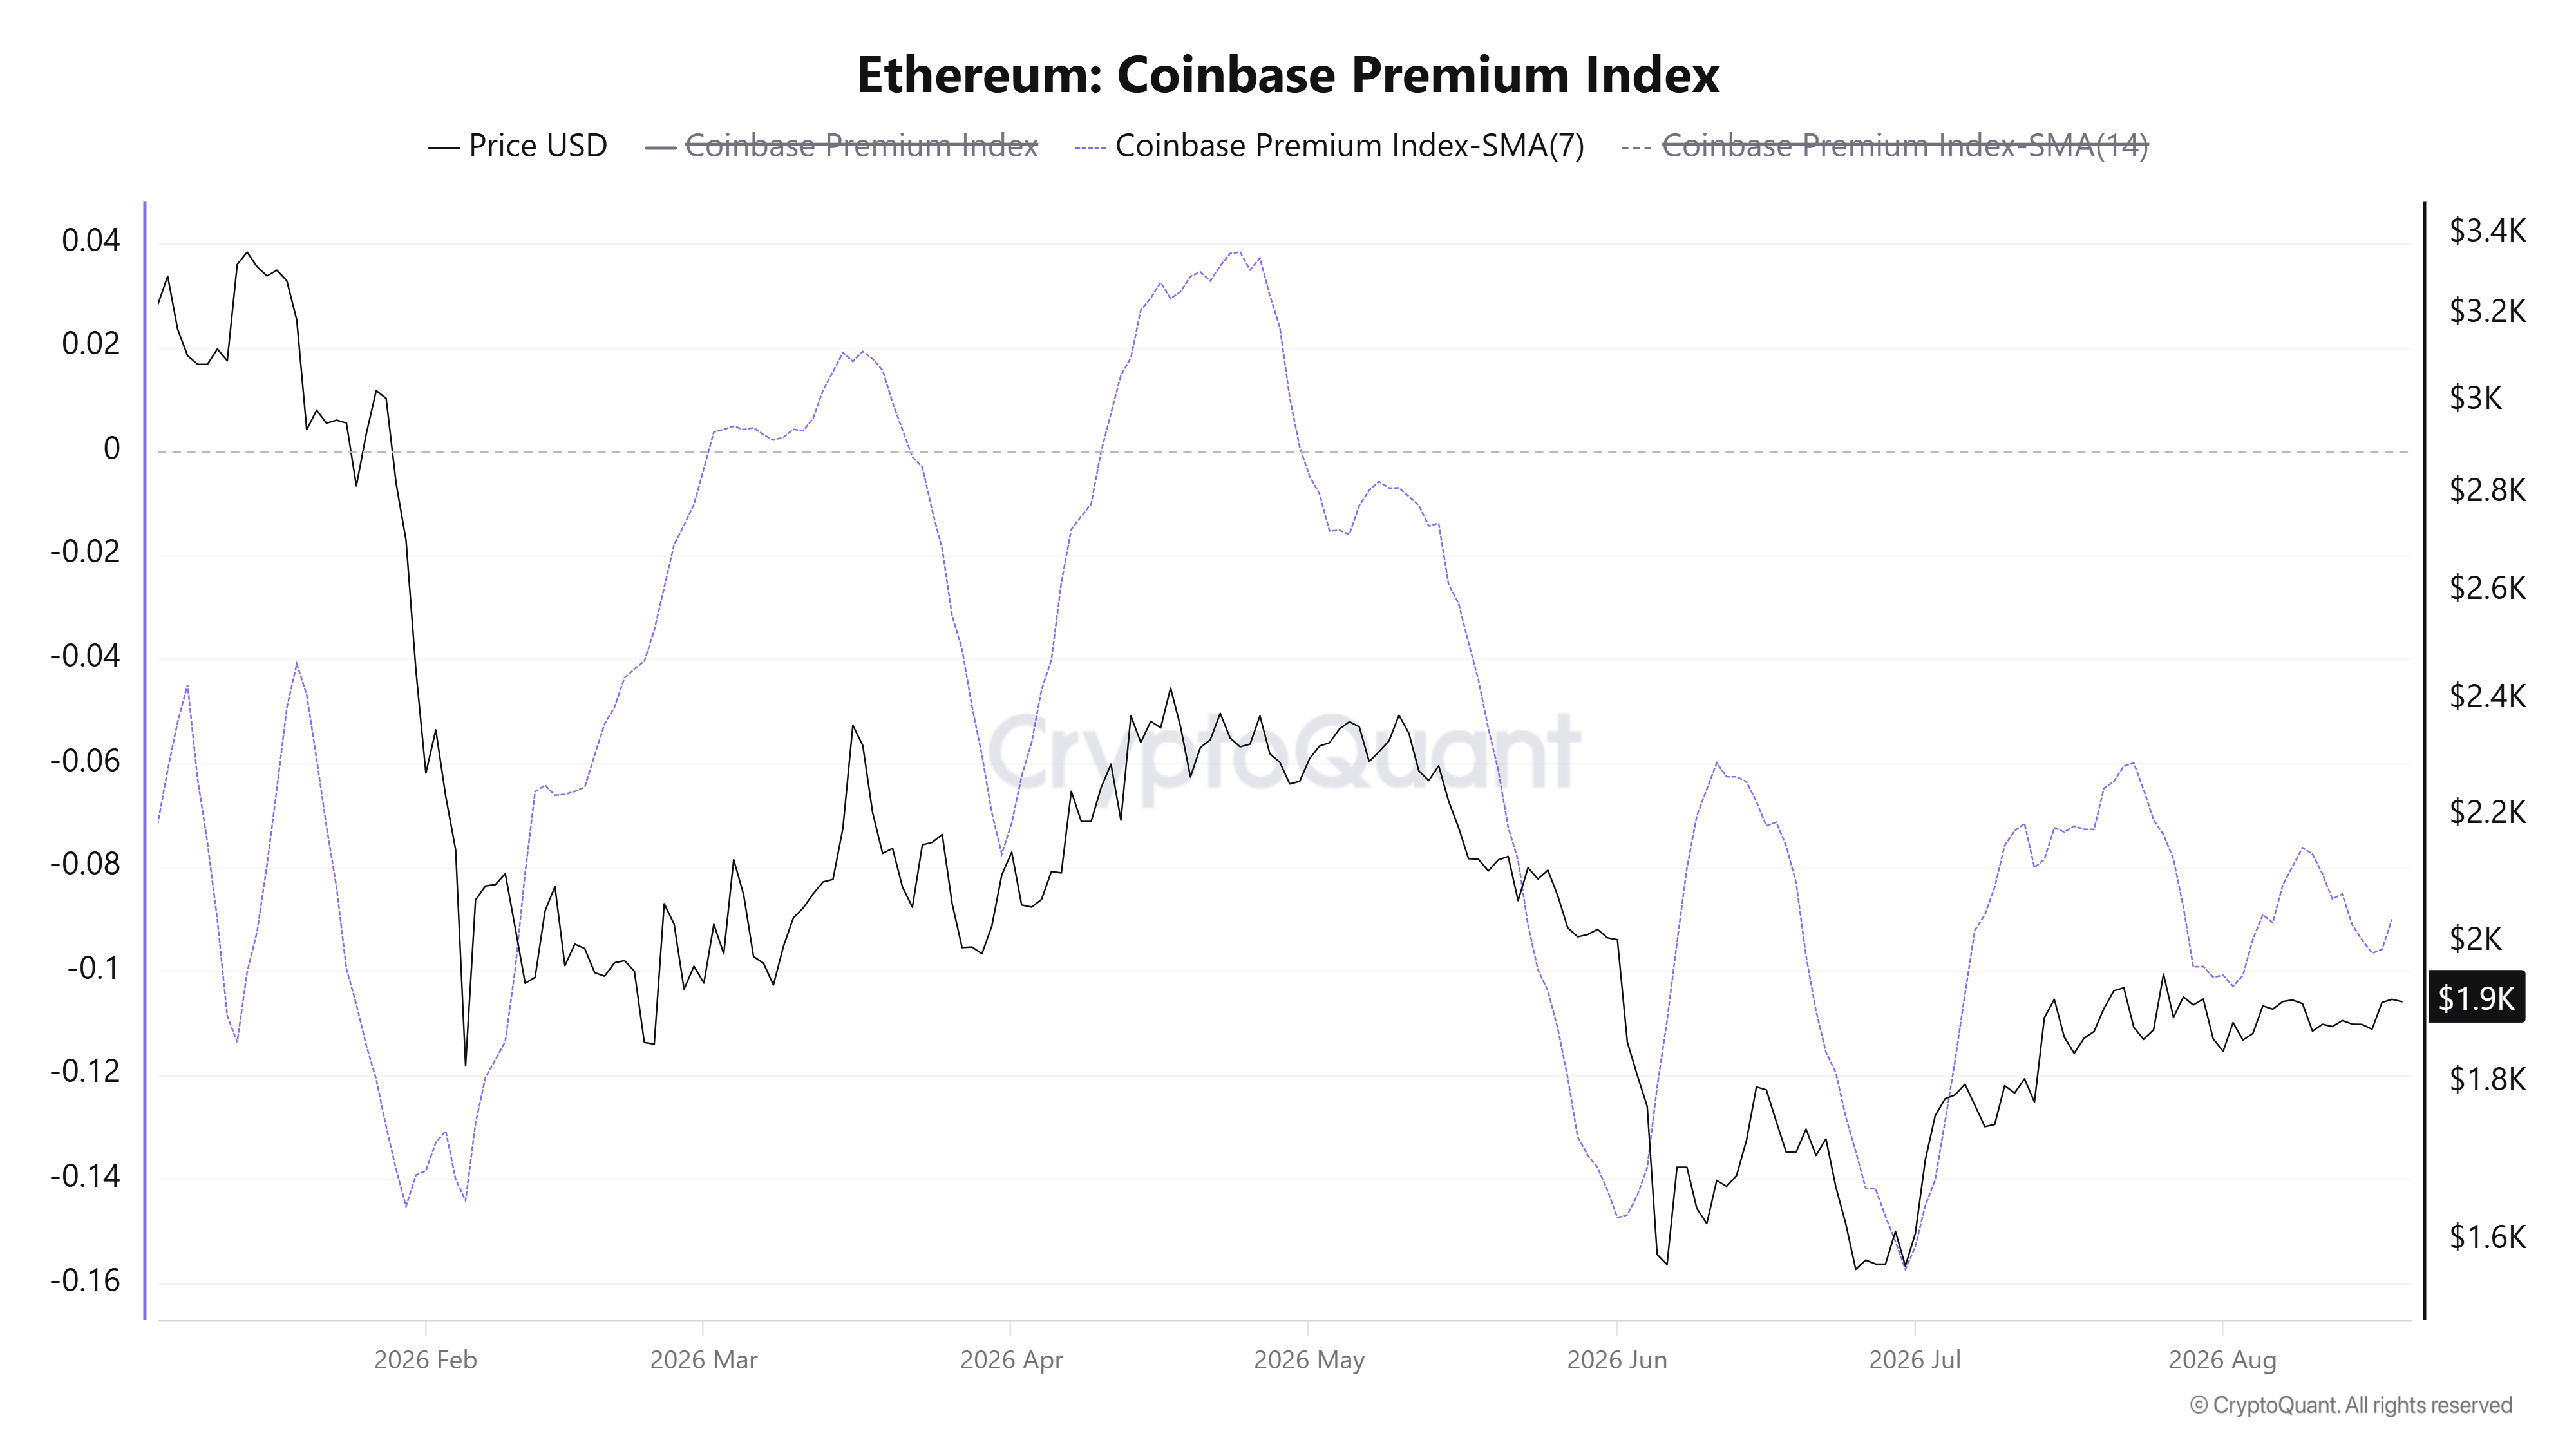
Still, the ETH Coinbase Premium Index, a measure of overall US sentiment, has hovered in negative territory for a majority of the year, suggesting US investors have yet to return. A move into positive territory may be needed for any sustained bullish move to materialize.
Ethereum technical outlook: ETH on the verge of flipping 100-day EMA resistance
Ethereum has seen $17.4 million in liquidations over the past 24 hours, led by $9.2 million in long liquidations, according to Coinglass data.
On the daily chart, ETH is maintaining a mildly bullish near-term bias as price holds above the 20- and 50-day Exponential Moving Averages (EMAs) clustered between roughly $1,889 and $1,870.
The 14-day Relative Strength Index (RSI) at 57 leans positive without signaling overbought conditions. At the same time, the Stochastic Oscillator (Stoch) near 73 suggests upside momentum is present but already stretching into moderately overbought territory, which could cap immediate follow-through if fresh buyers hesitate near nearby resistance.
On the topside, initial resistance is seen at the 100-day EMA followed by the horizontal barrier around $1,961. Further up is a higher structural cap near $2,172, with a more distant level at $2,431.
On the downside, the 20- and 50-day EMAs form immediate support, as ETH attempts to break above the tight EMA range. A deeper pullback would expose the next horizontal floors near $1,809 and $1,507.
(The technical analysis of this story was written with the help of an AI tool. Know more.)
Author

Michael Ebiekutan
FXStreet
With a deep passion for web3 technology, he's collaborated with industry-leading brands like Mara, ITAK, and FXStreet in delivering groundbreaking reports on web3's transformative potential across diverse sectors. In addition to



