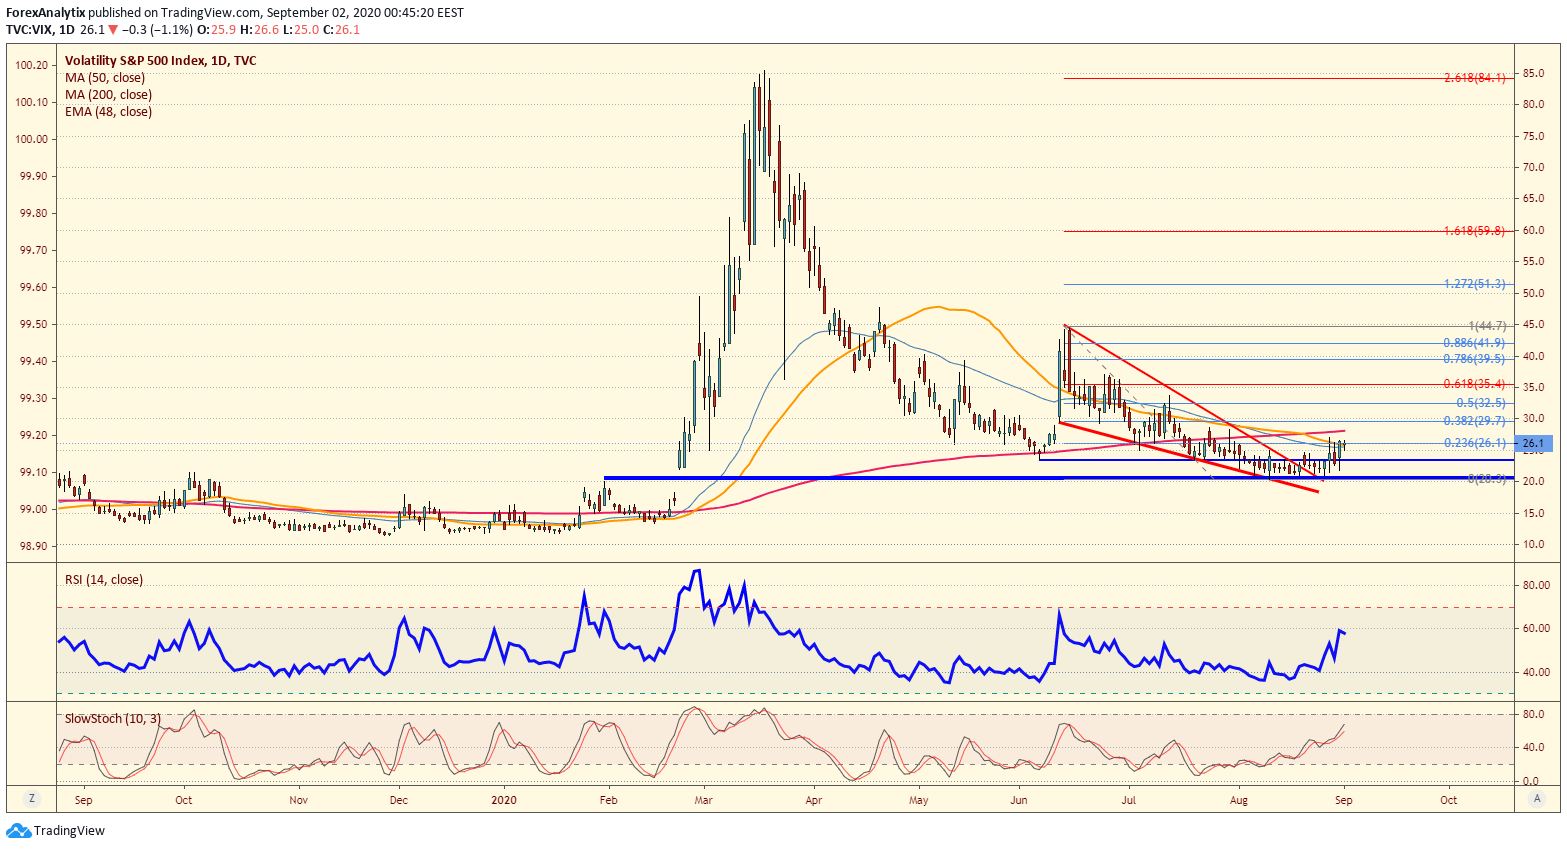
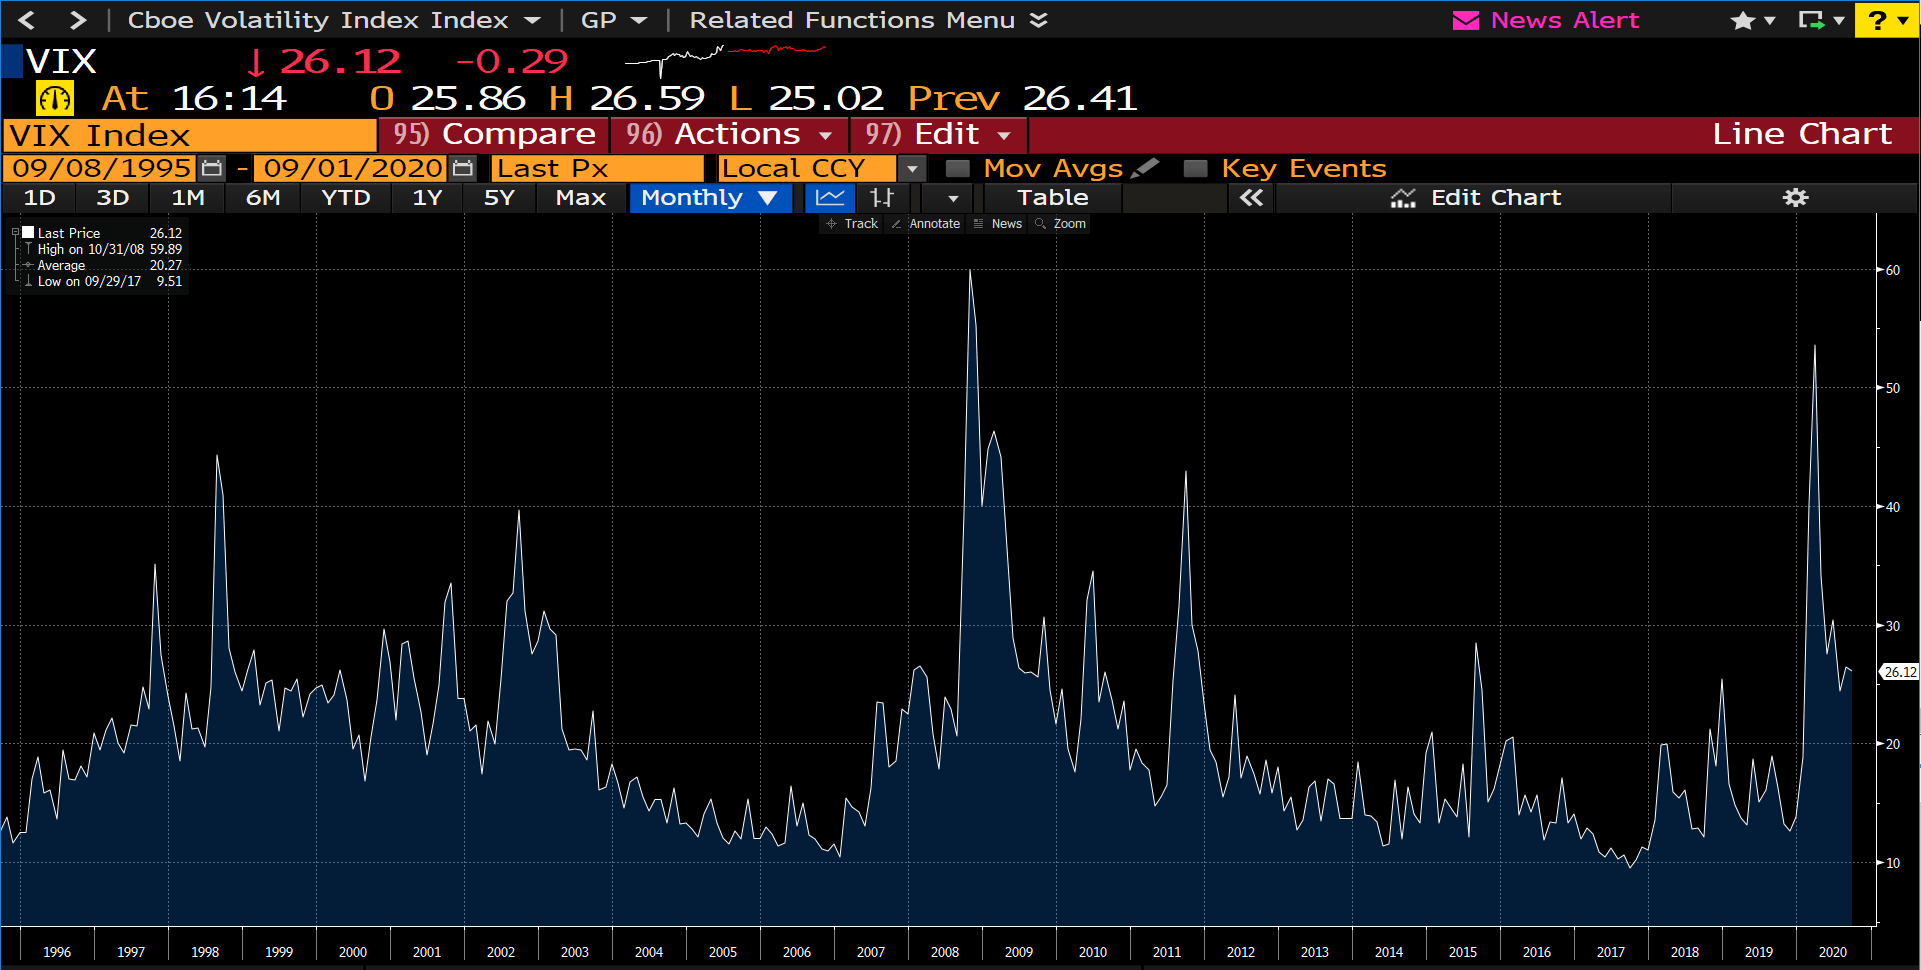
Chart of the day: Vix

I try not to do much technical analysis on the volatility index $VIX but it is worth noting a couple things. We are elevated, and while we are well above the 20 level, the risk remains high for a volatility event (spike in prices, lower OR higher!). The VIX daily chart shows a descending wedge and we are breaking higher out of the wedge. More importantly if you look at the monthly chart, it suggests that while we consolidate above the 20 level, the risk is for higher volatility in the coming week(s) ahead.
Author

Blake Morrow
Forex Analytix
Blake Morrow spent most of his professional career as the Chief Currency Strategist for Wizetrade group for 15 years, and then the Senior Currency Strategist for Ally Financial after the acquisition of Tradeking which owned the Wizetrade Group.


