|

Chart of the day: Gold

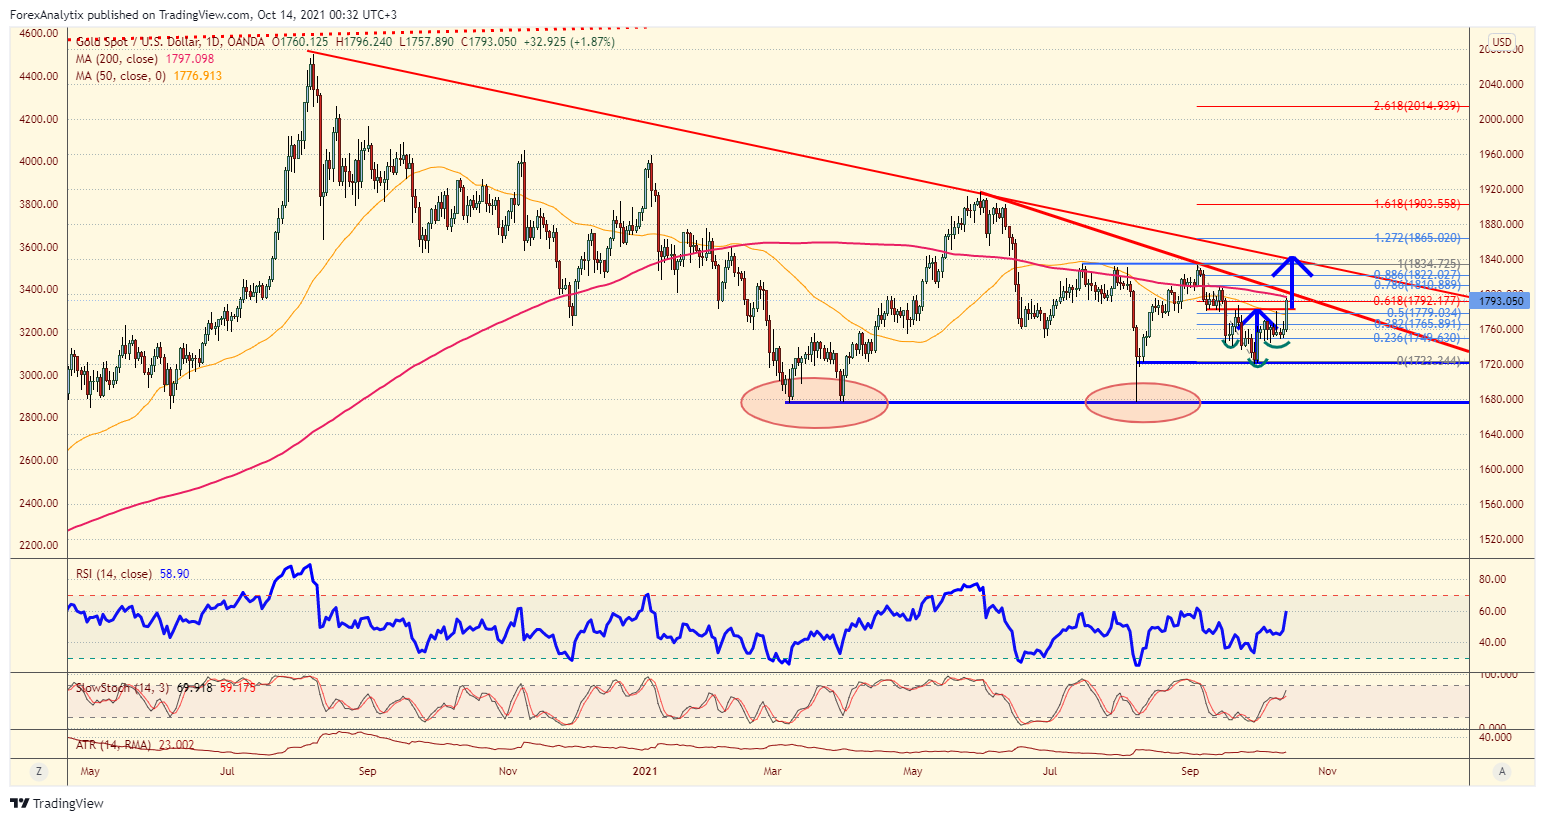
For weeks it has seemed no matter what happened gold went nowhere. But today was different! Gold broke higher out of a month long consolidation and looks to have developed an inverted head and shoulder pattern. The neckline was at the 1782 level and we close at 1793. RSI is pushing higher as well confirming the bullish momentum. A couple big issues for the yellow metal standout. 1) We close at the 200dma, and in recent months moves above the 200dma have failed. 2) we closed slightly above the 61.8% Fibonacci retracement of the September high to low. This is good news, but also these Fib levels can be zones too. Another daily close above the 1792 level would give the bulls some ease. If all goes well for the bulls we could be targeting the descending trend line at the 1840 level once again. 

Author

Blake Morrow

Blake Morrow

Forex Analytix

Blake Morrow spent most of his professional career as the Chief Currency Strategist for Wizetrade group for 15 years, and then the Senior Currency Strategist for Ally Financial after the acquisition of Tradeking which owned the Wizetrade Group.

More from Blake Morrow
Share:

Editor's Picks

EUR/USD bounces off lows, back to 1.1860

EUR/USD now manages to regain some balance, retesting the 1.1860-1.1870 band after bottoming out near 1.1830 following the US NFP data on Wednesday. The pair, in the meantime, remains on the defensive amid fresh upside traction surrounding the US Dollar.

GBP/USD rebounds to 1.3660, USD loses momentum

GBP/USD trades with decent gains in the 1.3660 region, regaining composure following the post-NFP knee-jerk toward the 1.3600 zone on Wednesday. Cable, in the meantime, should now shift its attention to key UK data due on Thursday, including preliminary GDP gauges.

Gold stays bid, still below $5,100

Gold keeps the bid tone well in place on Wednesday, retargeting the $5,100 zone per troy ounce on the back of humble gains in the US Dollar and firm US Treasury yields across the curve. Moving forward, the yellow metal’s next test will come from the release of US CPI figures on Friday.

Ripple Price Forecast: XRP sell-side pressure intensifies despite surge in addresses transacting on-chain 

Ripple (XRP) is edging lower around $1.36 at the time of writing on Wednesday, weighed down by low retail interest and macroeconomic uncertainty, which is accelerating risk-off sentiment.

US jobs data surprises to the upside, boosts stocks but pushes back Fed rate cut expectations

This was an unusual payrolls report for two reasons. Firstly, because it was released on  Wednesday, and secondly, because it included the 2025 revisions alongside the January NFP figure.

XRP sell-off deepens amid weak retail interest, risk-off sentiment

Ripple (XRP) is edging lower around $1.36 at the time of writing on Wednesday, weighed down by low retail interest and macroeconomic uncertainty, which is accelerating risk-off sentiment.