CFTC Report: Oil and Gold flows turn defensive while Yen longs rebuild

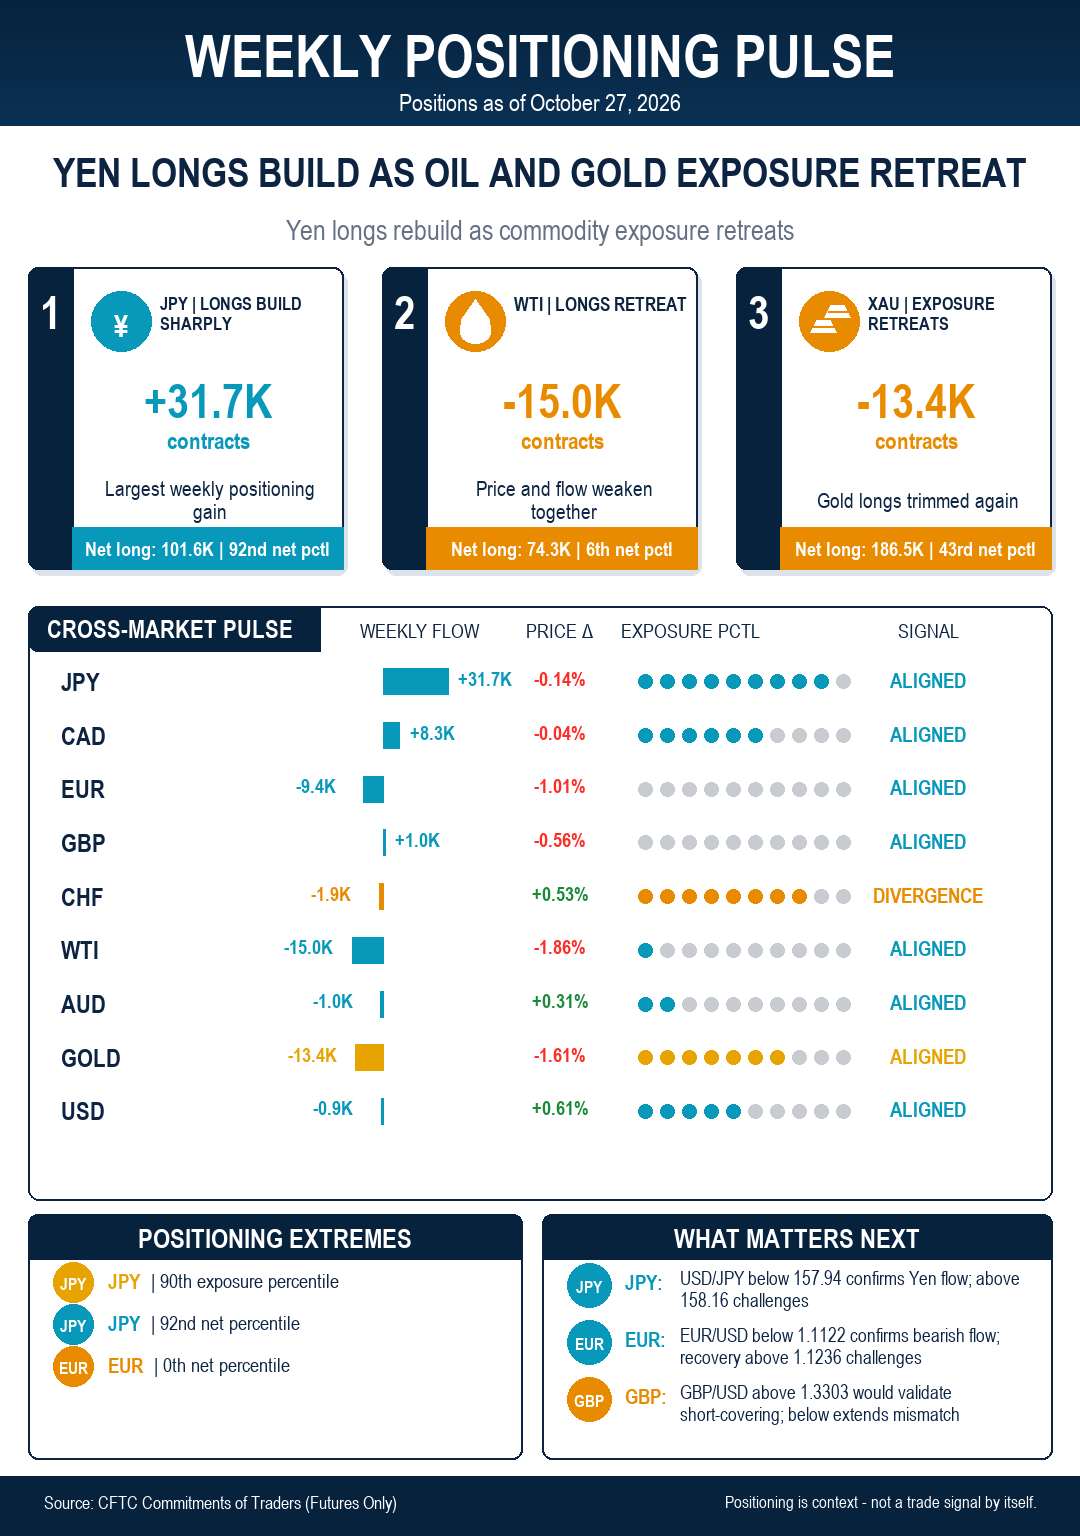
The week in one sentence: Yen longs rebuilt sharply in the week to October 27, while WTI and Gold exposure were cut alongside weaker prices. The Euro remained heavily shorted as the US Dollar strengthened, while Sterling provided the clearest price/flow mismatch.
Yen longs rebuild
Speculators moved decisively towards the Japanese Yen (JPY), with net longs climbing to six-week highs of around 101.6K contracts. USD/JPY dropped modestly during the period, so the market is confirming the positioning signal. Exposure is near the 90th percentile, and net positioning is near the 92nd. Further price confirmation would strengthen the move; a reversal would argue that the flow is fading.
WTI: Rally outruns speculative conviction
Non-commercial players turned less constructive on the WTI, reducing exposure to nearly 74.3K contracts, the lowest level since mid-July. This move, along with a decline in prices to the area below the $100.00 mark, confirms the positioning signal. In addition, speculative exposure is near the 6th percentile as well as the net positioning percentile. Further price confirmation would reinforce this development, while a reversal would suggest that the flow is weakening.
Price and positioning are still at odds
The British Pound (GBP) was the clearest mismatch. Speculators trimmed net shorts by around 1.0K contracts, suggesting a modest improvement in the sentiment surrounding the Sterling, yet GBP/USD fell modestly, revisiting the 1.3300 zone. The market therefore moved against the flow rather than confirming it. A recovery through 1.3303 would give the short-covering signal more credibility; continued weakness would show that price is still the stronger message.
Where the flow has confirmation
The clearest confirmation came from JPY, the Canadian Dollar (CAD) and the Euro (EUR). Yen longs expanded as USD/JPY slipped, CAD short-covering coincided with a lower USD/CAD, and deeper Euro shorts were accompanied by another decline in EUR/USD. In each case, the price moved in the same direction as the positioning change, giving the signal better tactical support, although follow-through is still required.
The crowded trade
JPY is the report's most crowded exposure, at the 90th percentile. That does not mean a reversal is imminent, but it does mean that a turn in USD/JPY could trigger a larger adjustment because speculative exposure is already heavily concentrated in the trade. The risk is therefore one of asymmetry: the position can continue to work, but a break in momentum may generate an outsized unwind.
Positioning map
The map places JPY at the top of the exposure distribution, at the 90th percentile, while its outright net position also ranks highest at the 92nd percentile. The Australian Dollar (AUD) is at the opposite end of the net-positioning scale, near the 0th percentile, indicating unusually light ownership. Exposure measures how crowded a position is relative to open interest; the net percentile measures its absolute historical size. Read together, the map shows both where positioning is most concentrated and where there is most room to rebuild.
Author

Pablo Piovano
FXStreet
Born and bred in Argentina, Pablo has been carrying on with his passion for FX markets and trading since his first college years.