Cass Year-Over-Year Freight Index Sinks to a 12-Year Low

Year-over-year, the Cass shipping index turned in its worst performance since the Great Recession.
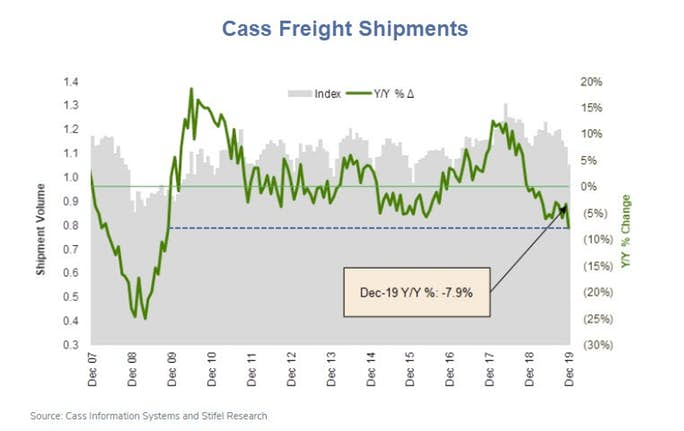
The Cass Freight Shipment Index is still sounding recession alarm bells.
There is lots of hope in the stock market and the freight market for a better 2020, but the trends have yet to turn. Maybe with the January index readings? Doubtful, as the index (both shipments and expenditures) normally falls off sequentially from December to January, which would imply another negative y/y comp ahead. Our view is that the second quarter of 2020 has the best chance of seeing actual y/y growth in shipments and freight costs, if traditional seasonal freight patterns hold, as the second quarter of 2019 did not see the typical seasonal surge in activity.
Shipment volumes dropped 7.9% vs December 2018 levels, as the index posted its lowest reading since January 2018. It was also the steepest y/y decline since the Great Recession of 2008-2009. Although there were the same number of working days in December 2019 and December 2018, some industry participants we’ve spoken with about the sluggish end to the year cited Christmas and New Year’s Day both falling on a Wednesday as the reason for soft volume and low productivity the last week or so.
Shipments
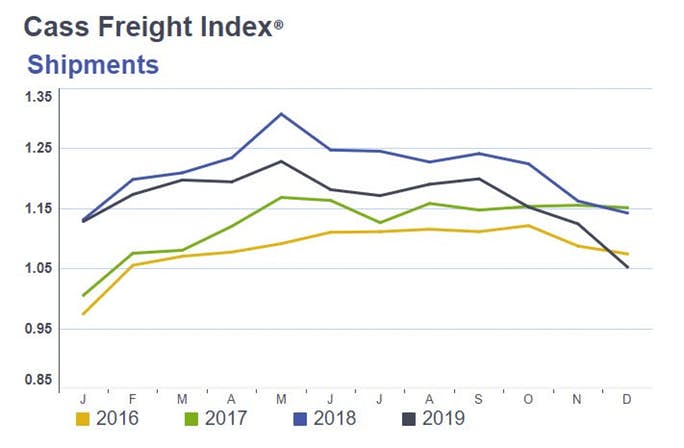
Shipping volumes in december of 2019 were lower than in 2018, 2017, and 2016.
Inventories

Regardless of the holiday effect, the freight market is weak, largely due to higher inventories and contraction in the manufacturing economy, as noted by December’s 2019-low ISM reading of 47.2 (its lowest level since June 2009). And while we expect comps to ease and volumes to flatten out, we are not forecasting much growth in terms of freight volumes in 2020. The U.S. industrial economy – rebound or no rebound – will likely be the biggest swing factor. And the tariff relief from the Phase 1 deal seems to be just that – a relief for some, but not a stimulus.
US Rail Carloads
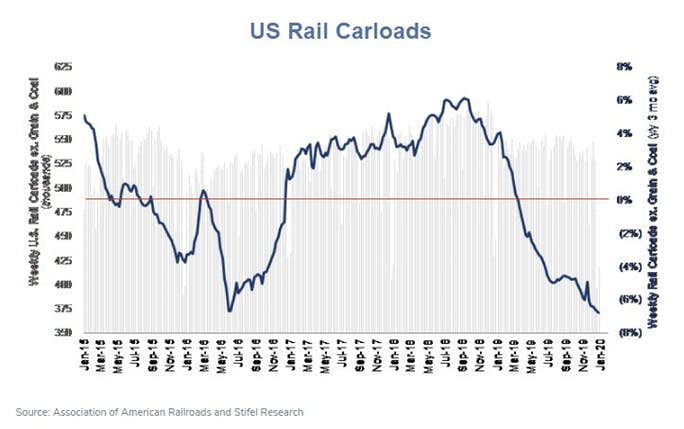
U.S. rail y/y carload declines seen all year accelerated in 4Q19, reaching its lows in December
Shipping Expenditures
December’s (6.2%) y/y decline in expenditures was the weakest result since mid-2016.
The 2015-2016 decline was energy-based. In contrast, the 2019 slump is broad based.
Trump's tariffs exacerbated the problems.
Truckload Linehaul Index
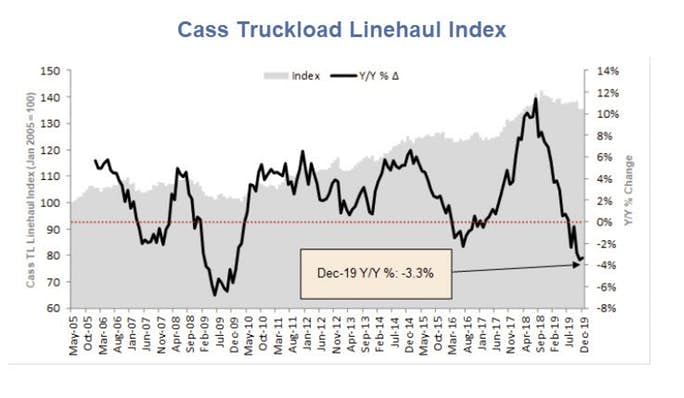
The Cass Truckload Linehaul Index is also the lowest year-over-year since the Great Recession. Once again, this is not energy related.
Fed's Beige Book Shows Modest Economic Expansion in Last 6 Weeks of 2019
Although the Fed's Beige Book Shows Modest Economic Expansion in Last 6 Weeks of 2019 the Philadelphia, St. Louis, and Kansas City Fed regions reported sub-par growth.
Importantly, manufacturing activity was essentially flat in most Districts, as in the previous report.
Manufacturing Flat
Given that Manufacturing ISM Down 5th Month to Lowest Since June 2009 it's no surprise to see the manufacturing is struggling nationally.
Cass also cited the ISM data and noted "the tariff relief from the Phase 1 deal seems to be just that – a relief for some, but not a stimulus."
I concluded the same three days ago in Trump and China to Sign Trade War Ceasefire on Wednesday The deal is now signed. Hooray!
Ceasefire or Truce
Whereas I likened the deal to a "ceasefire", economist Dave Rosenberg today labeled it a "truce".
"We can now call this a truce ─ even the Politburo is putting a positive spin on this back in China on state television ─ even if it’s a fragile truce," commented Rosenberg in Breakfast With Dave.
OK China will buy more US stuff, allegedly. But tariffs remain, as do questions.
Author

Mike “Mish” Shedlock's
Sitka Pacific Capital Management,Llc


