Canadian CPI inflation slows to 2.0% in August

Inflationary pressures in Canada continued to subside in August, underpinning the possibility of more policy easing this year.
According to a report released by Statistics Canada (StatCan) earlier today, headline CPI inflation (Consumer Price Index) cooled to +2.0% in August (YoY), down from +2.5% in July and south of economists’ expectations of +2.1%.
This marks the first time since February 2021 that the headline inflation rate has hit the Bank of Canada’s (BoC) 2.0% inflation target and highlights the eighth consecutive month that headline inflation has remained within the central bank’s inflation band of 1-3%.
StatCan noted that the deceleration in inflation for August was ‘due, in part, to lower gasoline prices, due to a combination of lower prices and a base-year effect’.
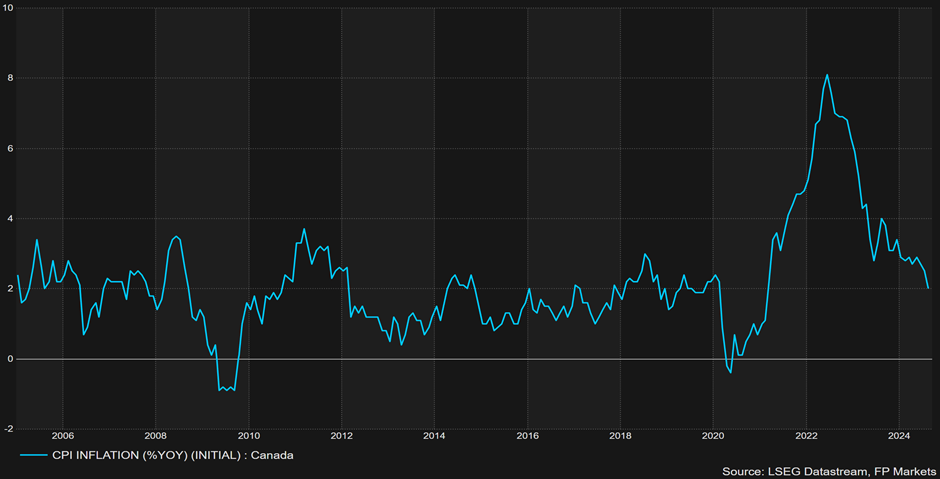
Headline CPI inflation dropped -0.2% between July and August, defying the market’s median estimate of a flat reading and below the +0.4% previous print.
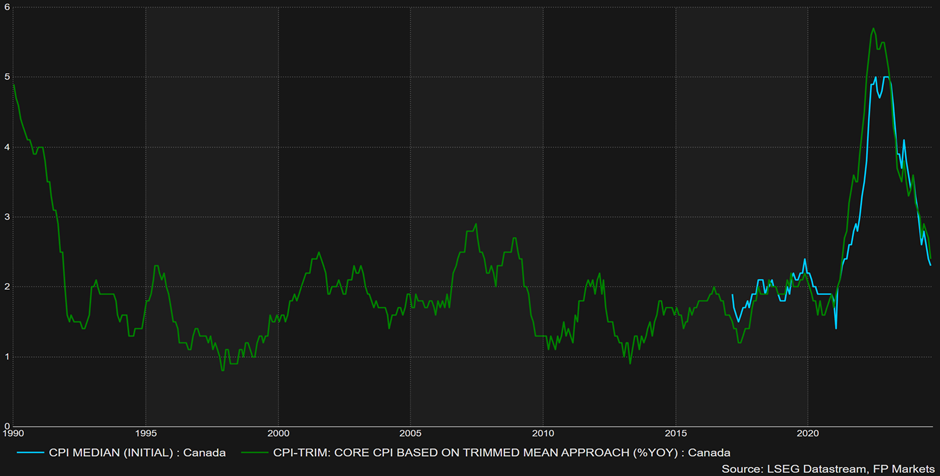
The BoC’s preferred measures of inflation also continued to slow in August. The CPI Median rose +2.3% from +2.4% in July (consensus: +2.2%), while the CPI Trim measure rose +2.4% from +2.7% in July (consensus: +2.5%). Therefore, the average pace of inflation between these two measures is +2.35%, down from +2.55 in July. Additionally, the CPI Common measure was lower in August at +2.0%, down from +2.2% in July.
25 or 50?
The BoC next meets on 23 October, where markets are fully pricing in the possibility of another rate cut. Following the release of inflation data, OIS traders (Overnight Index Swaps) are pricing in 39 basis points of cuts for next month’s meeting, with 75 basis points of easing for the year. At current levels, whether the BoC opts for a 25 or 50 basis point reduction in October is essentially a coin toss.
The central bank cut rates for a third consecutive meeting in September and signalled that further rate cuts are on the table. The latest rate cut brought the Overnight Rate to 4.25%.
USD/CAD resistance
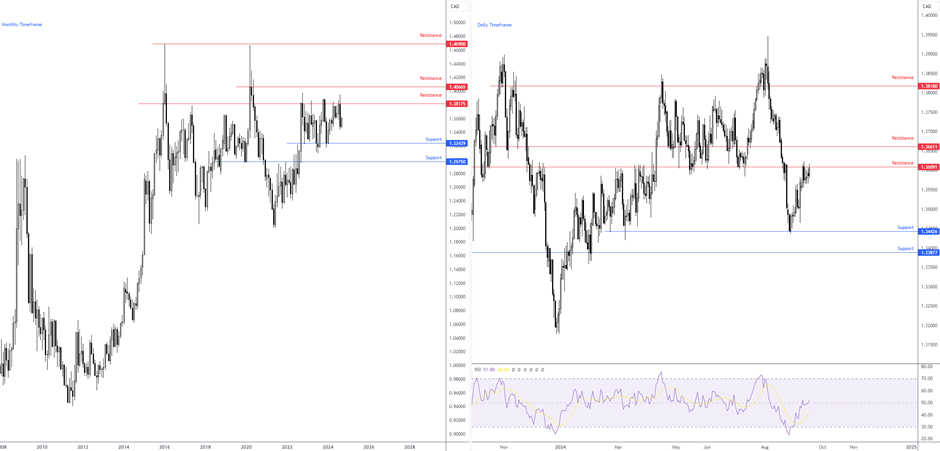
Longer-term price action has remained rangebound between monthly support at C$1.3244 and resistance coming in from C$1.3818 since late 2022. As you can see from the monthly chart, price faded range resistance in August, and follow-through downside has so far been limited. Areas of support and resistance beyond the current range reside at C$1.2975 and C$1.4066.
Across the page on the daily chart, support entered the fray at C$1.3443 – some technical analysts will refer to this base as a Quasimodo support level. The reaction from the base was strong and eventually saw the currency pair shake hands with resistance at 1.3609, a level boasting strong historical significance and one which has proven to be a difficult barrier to overcome. However, having seen the Relative Strength Index (RSI) nudge back above its 50.00 centreline (positive momentum), a break higher could be on the cards, with buyers targeting neighbouring daily resistance at C$1.3661.
Author

Aaron Hill
FP Markets
After completing his Bachelor’s degree in English and Creative Writing in the UK, and subsequently spending a handful of years teaching English as a foreign language teacher around Asia, Aaron was introduced to financial trading,


