CAD/JPY: Double-Top resistance is in play

CAD/JPY produced two consecutive bullish candles on the daily chart. Yesterday’s candle closed within a level of resistance, where the price had a rejection three days earlier. The H4 and the H1 chart suggest that the pair may make a strong bearish move. Thus, it may end up producing a bearish daily candle at a double top resistance. Let us have a look at those three charts.
Chart 1 CAD/JPY Daily Chart
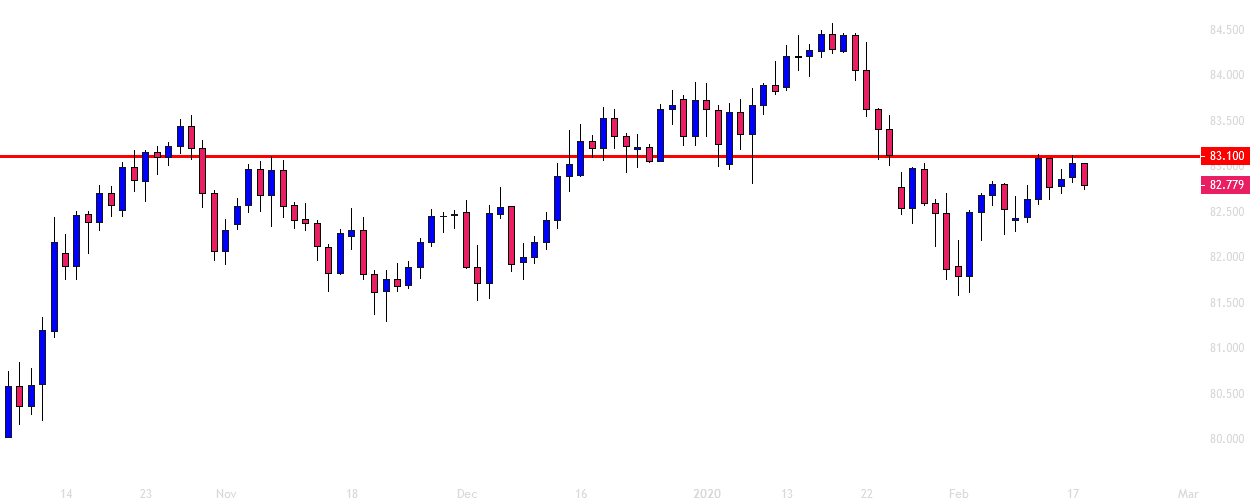
The chart shows that the price had a rejection at the level of 83.100 and produced a bearish inside bar on Thursday. If the pair provides another bearish reversal candle at the same level, the sellers may go short on the pair and drive the price towards the South further. It may find its next support at the level of 81.750. The last two daily candles are bullish. This may have attracted intraday buyers to go long on the pair today. However, as of writing, intraday charts have been bearish biased as well. Let us have a look at two major intraday charts.
Chart 1 CAD/JPY H4 Chart
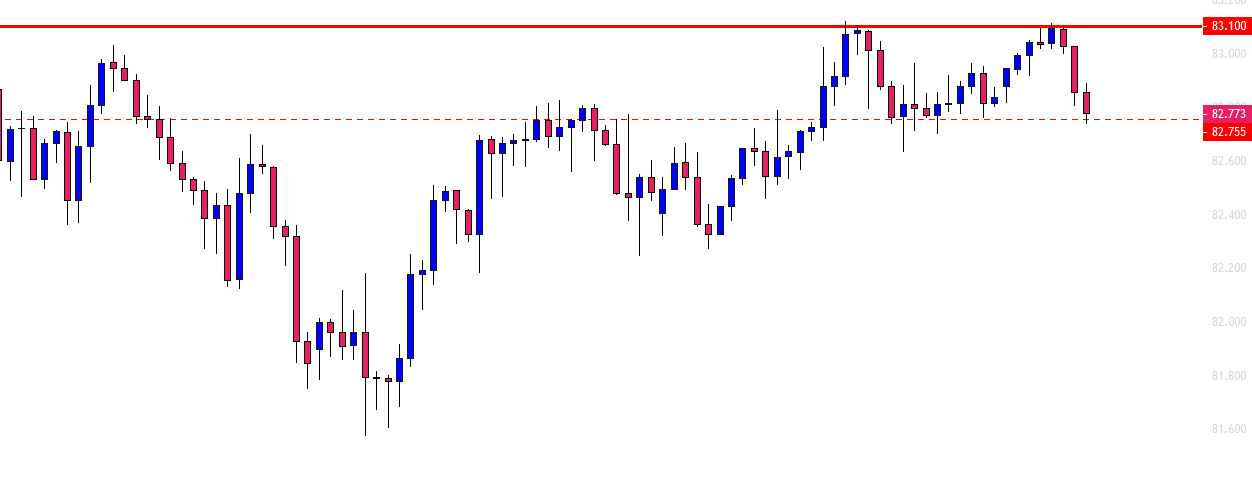
The H4 chart clearly shows that the price had rejection at the level of 83.100 twice, and the pair is trading around the level of 82.775. The level of 82.775 is the neckline level. If the sellers get an H4 breakout at the neckline level, they may go short on the pair. The price may find its next support at the level of 82.315. It may as well make a breakout at the level of 82.315 and go up to the level of 81.775. On the contrary, if the neckline level works as a level of support and produces a bullish reversal candle, the price may head towards the level of 83.635 upon a breakout at the level of 83.100.
Chart 1 CAD/JPY H1 Chart
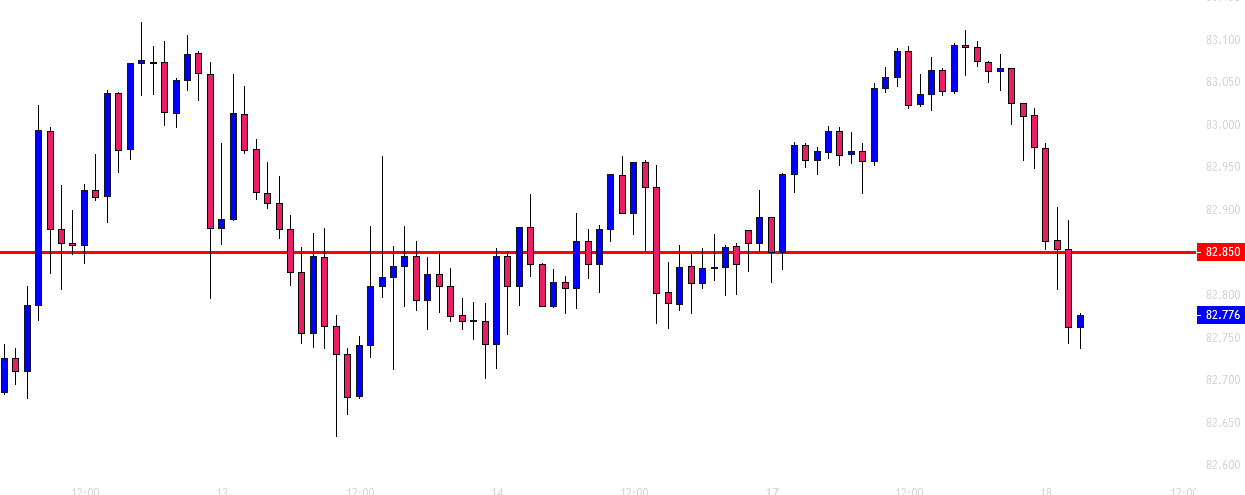
The chart shows that the price has breached through the level of 82.850. The pair is trading below the level. It may go back to the level for a correction. The sellers may wait for a bearish reversal candle at that level and take entry on the ABC pattern trade setup. If the level produces a bearish reversal candle, the price may head towards the level of 82.520 with good bearish momentum.
Considering all three charts, it seems that the bear is going to dominate on the pair today. If the daily chart produces a strong bearish candle, the sellers may dominate on the pair for some days.
Author

EagleFX Team
EagleFX
EagleFX Team is an international group of market analysts with skills in fundamental and technical analysis, applying several methods to assess the state and likelihood of price movements on Forex, Commodities, Indices, Metals and


