Stocks: Bullish Expectations Following Yesterday's Decline, New Uptrend Or Just Bounce?

Briefly:
Intraday trade: Our Wednesday's intraday trading outlook was bearish. It proved accurate because the S&P 500 index lost 0.6%, following lower opening of the trading session. The market fell the lowest since late October, before bouncing off support level. The index almost reached our intraday profit target level of 2,555 (daily low at 2,557.45). We still can see medium-term negative technical divergences. Expectations before the opening of today's trading session are positive, but the market may resume its downtrend at some point. Therefore, intraday short position is favored again. Stop-loss is at the level of 2,595 and potential profit target is at 2,545 (S&P 500 index).
Our intraday outlook is bearish today. Our short-term outlook is neutral, and our medium-term outlook is neutral:
Intraday outlook (next 24 hours): bearish
Short-term outlook (next 1-2 weeks): neutral
Medium-term outlook (next 1-3 months): neutral
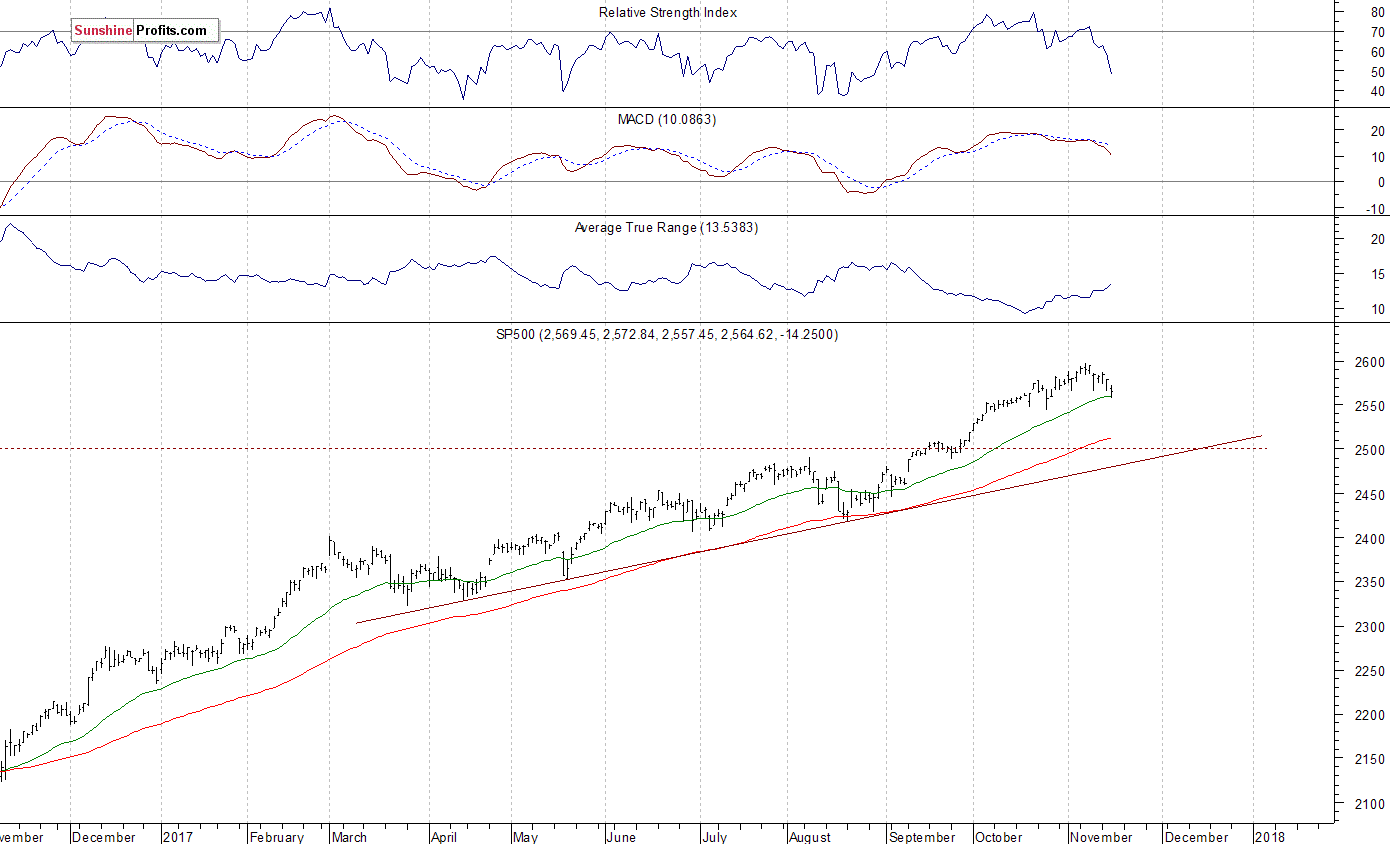
The U.S. stock market indexes lost 0.5-0.6% on Wednesday, extending their recent move down, as investors reacted to global stock markets' decline, economic data releases, among others. The S&P 500 index fell the lowest since late October and it traded slightly below the level of 2,560 yesterday. It is now around 1.2% below last week's Tuesday's all-time high of 2,597.02. The Dow Jones Industrial Average continued its short-term downtrend, as it lost 0.6%. The technology Nasdaq Composite was relatively stronger than the broad stock market, as it closed within its two-week-long consolidation along the level of 6,700-6,800. The nearest important level of support of the S&P 500 index is now at 2,555-2,560, marked by local low. The next support level is at around 2,545, marked by some October local lows. On the other hand, resistance level is at 2,580-2,585, and the next level of resistance is at 2,595-2,600, marked by record high. The S&P 500 index retraces some of its September-November rally. Is this a topping pattern or just downward correction before another leg up? There have been no confirmed negative signals so far. However, we can see medium-term technical overbought conditions along with negative technical divergences:
Positive Expectations
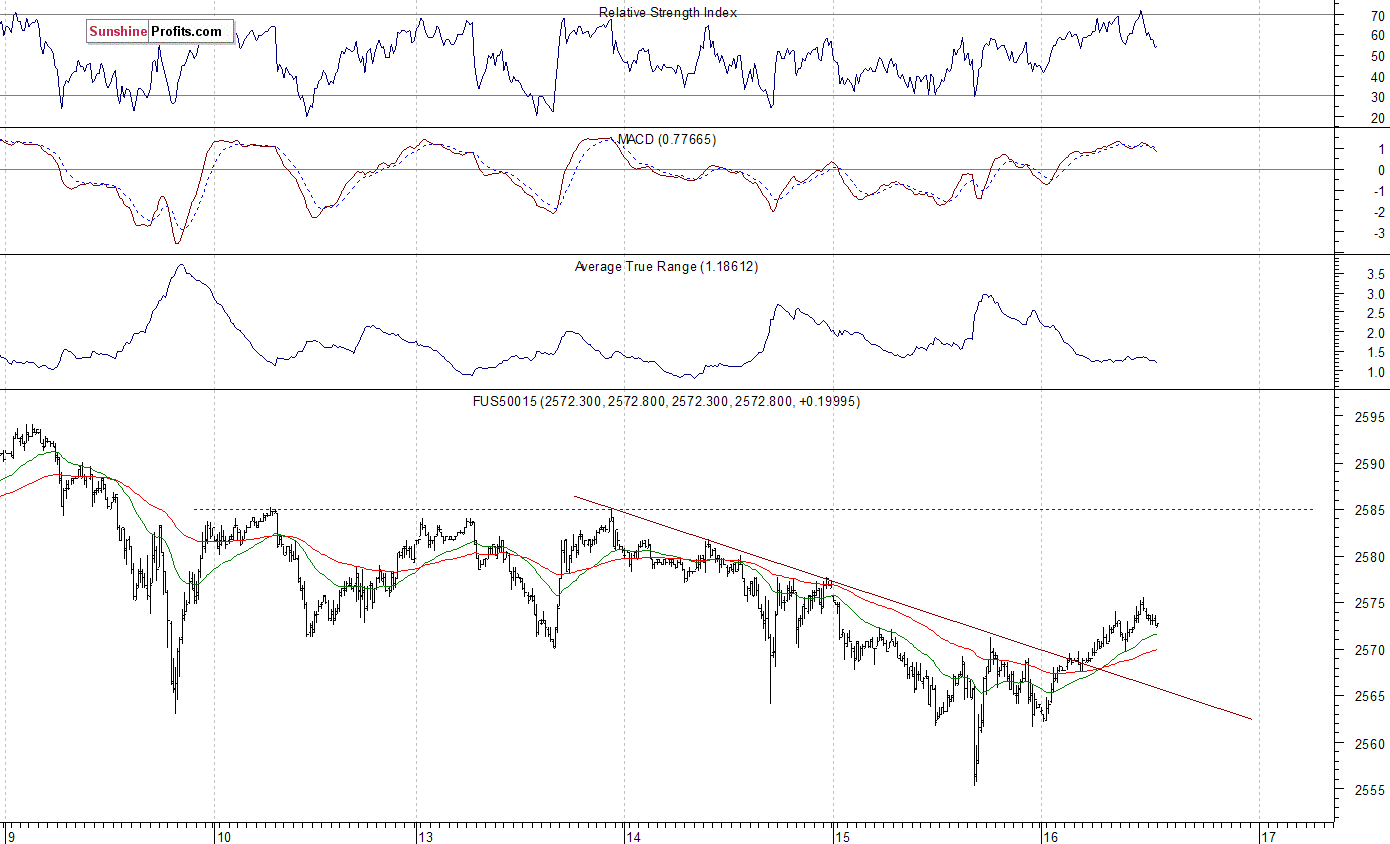
Expectations before the opening of today's trading session are positive, with index futures currently up 0.3-0.4% vs. their Wednesday's closing prices. The European stock market indexes have gained 0.1-0.6% so far. Investors will wait for some economic data announcements: Initial Claims, Philadelphia Fed Manufacturing Index at 8:30 a.m., Industrial Production, Capacity Utilization at 9:15 a.m., NAHB Housing Market Index at 10:00 a.m. The market expects that Industrial Production grew 0.5% in October. The S&P 500 futures contract trades within an intraday uptrend, as it retraces some of its recent decline. The nearest important level of resistance is at around 2,575-2,580, marked by short-term local highs. The next resistance level is at 2,585-2,595. On the other hand, support level is at 2,555-2,560, marked by yesterday's local lows. The futures contract broke above its recent downward trend line, as we can see on the 15-minute chart:
New Uptrend Or Just Retracement?
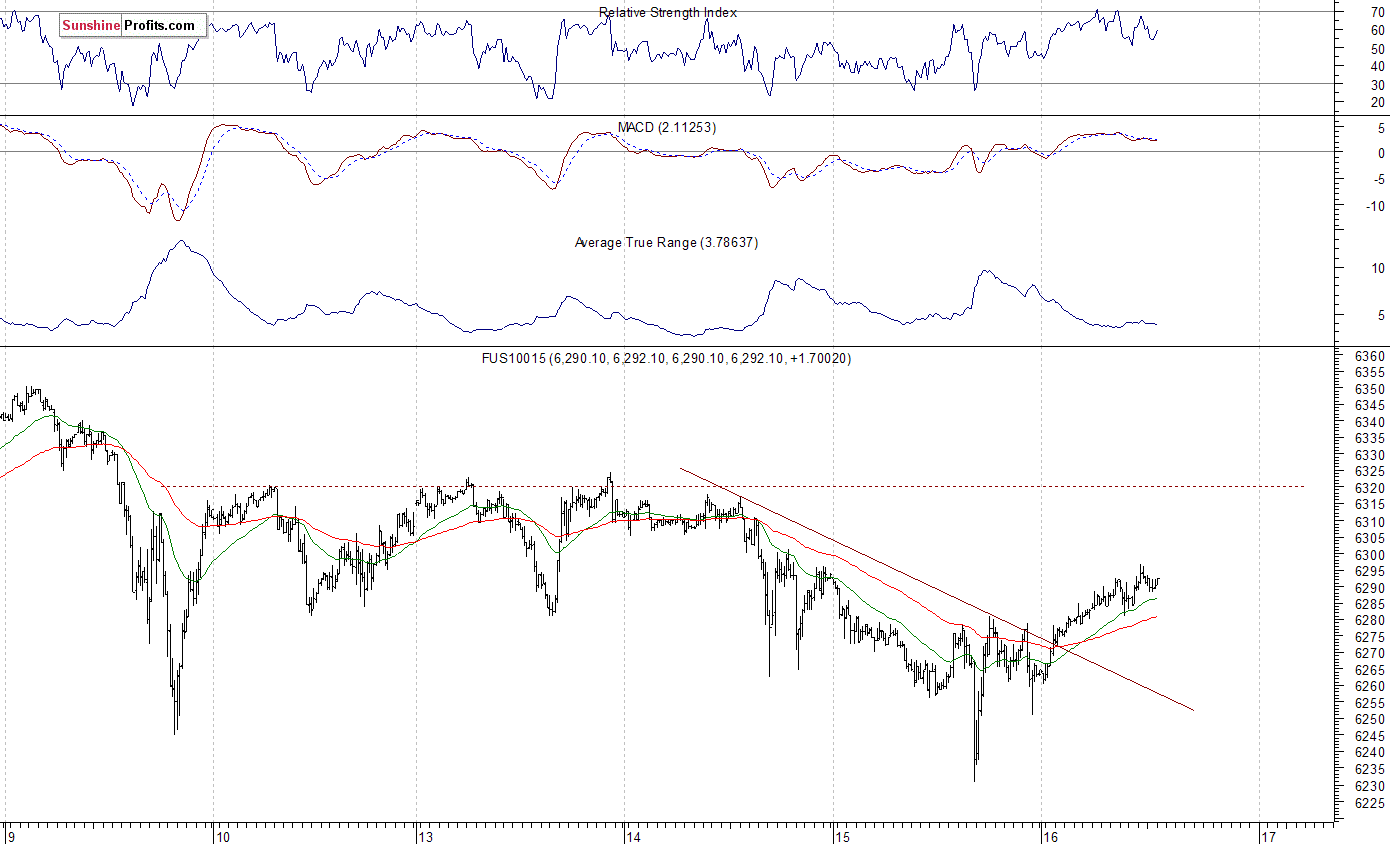
The technology Nasdaq 100 futures contract follows a similar path, as it retraces its recent move down. The market broke below its last week's local low yesterday, before bouncing off support level at around 6,230-6,250. The nearest important level of resistance is at 6,300-6,320, marked by some previous fluctuations. The Nasdaq 100 futures contract trades closer to 6,300 mark, as the 15-minute chart shows:
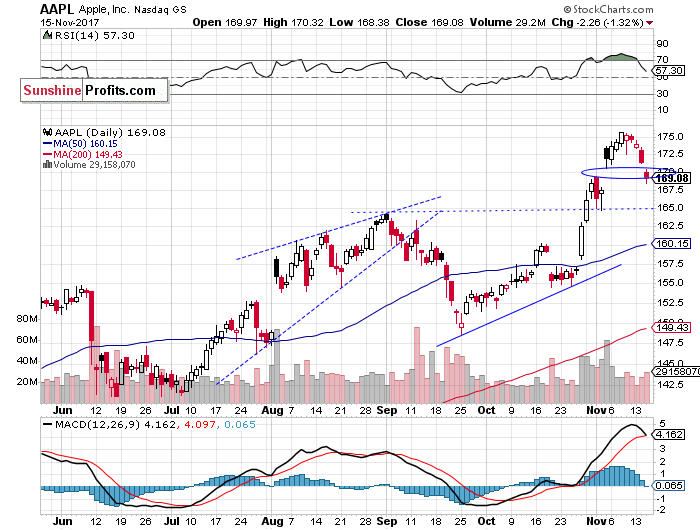
Let's take a look at Apple, Inc. stock (AAPL) daily chart again. The price reached new record high on Wednesday last week, as it extended its uptrend following better-than-expected quarterly earnings release. Since then, Apple stock remains within a short-term downtrend. It closed its November 3 daily gap up yesterday. Will it continue lower or bounce off support level at around $165-$170?
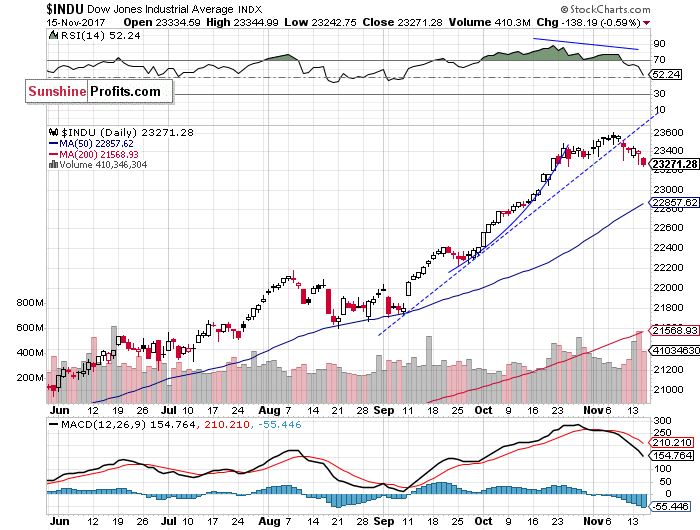
The Dow Jones Industrial Average daily chart shows that blue-chip index extended its short-term downtrend following breakout below two-month-long upward trend line on Thursday last week. Is this a downward reversal or just quick downward correction? We still can see some negative technical divergences. The most common divergences are between asset’s price and some indicator based on it (for instance the index and RSI based on the index). In this case, the divergence occurs when price forms a higher high and the indicator forms a lower high. It shows us that even though price reaches new highs, the fuel for the uptrend starts running low:
Concluding, the S&P 500 index extended its short-term downtrend on Wednesday, before bouncing off support level. Investors took profits off the table following October-November rally. The broad stock market trades around 1.2% below last week's new record high. Is this a new downtrend or just quick downward correction before another leg up? We still can see medium-term overbought conditions along with negative technical divergences. However, there have been no confirmed medium-term negative signals so far. For now, it looks like another consolidation within a year-long rally.
Want free follow-ups to the above article and details not available to 99%+ investors? Sign up to our free newsletter today!
Author

Paul Rejczak
Sunshine Profits
Paul Rejczak is a stock market strategist who has been known for the quality of his technical and fundamental analysis since the late nineties.


