Brexit uncertainty drags on again as major markets lack conviction [Video]
![Brexit uncertainty drags on again as major markets lack conviction [Video]](https://editorial.fxstreet.com/images/Macroeconomics/Events/ElectionUK/Brexit_scrabble_XtraLarge.jpg)
Market Overview
Markets have opened on Monday in a state of renewed limbo again. There is still a lack of real detail or progress of note for the US/China “Phase One” of a trade agreement. However, the major damp squib has come from the “Super Saturday” session of UK Parliament which has failed to provide markets with any further clarity of whether the UK will be leaving the EU on 31st October or not. MPs opted instead to request Prime Minister Johnson to ask for an extension to Article 50, which he did so with the enthusiasm of a recalcitrant child asked to eat their vegetables. Akin to hiding his carrots under the cutlery, Johnson refused to sign his name to the letter. How the EU responds will be interesting now, but the letter has further reduced the likelihood of a “no deal” Brexit. Sterling has dropped amidst the cloud of uncertainty, but has avoided any huge moves that could have come from a decision of any conviction actually having been made by the UK Parliament. Broad market sentiment also reflects a lack of direction, as Treasury yields continue to crab sideways, and commodities consolidate. There has been an element of dollar slippage in recent days, as yields on Bunds and JGBs (and to an extent Gilts) remain on a positive trend, but this has also stalled today.

Wall Street closed lower on Friday with the S&P 500 -0.4% at 2986, whilst US futures are a shade higher today at +0.1%. Asian markets have been mixed, with the Nikkei +0.3% whilst the Shanghai Composite is -0.4%. European markets seem set to add to the caution with FTSE futures all but flat and DAX futures +0.1%. In forex majors there is a mixed look to USD across the majors, gaining against EUR and JPY whilst AUD and NZD are mild outperformers. The main mover has been GBP weakness, although sterling is off the lows of the day. In commodities, gold and oil are mixed again.
There are no key data announcements on the economic calendar today.
Chart of the Day – AUD/USD
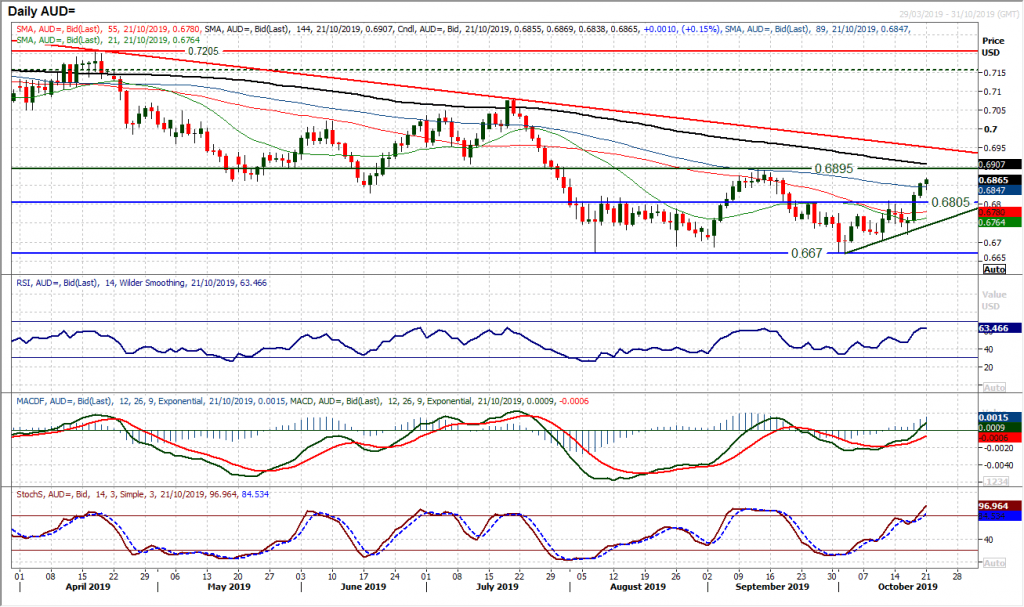
Improved performance of the Aussie has been a slow burn in the past couple of weeks, but has really taken off in recent sessions. Higher lows and higher highs have significantly improved the outlook and now Thursday’s strong bull candle breakout above $0.6805 is a key move that opens a test of the $0.6895 key September high. Positive momentum indicators are driving the move, with the RSI pushing into the 60s, Stochastics strongly configured and MACD lines accelerating higher. The breakout at $0.6805 is effectively a pivot line of the past few months and is now a key basis of support to use to buy into weakness, whilst the hourly chart shows $0.6800/$0.6820 as a near term band of support. There is little real resistance until the $0.6895 high. A test of $0.6895 will be crucial for the medium term outlook and the bulls are positioning well for the test.
WTI Oil
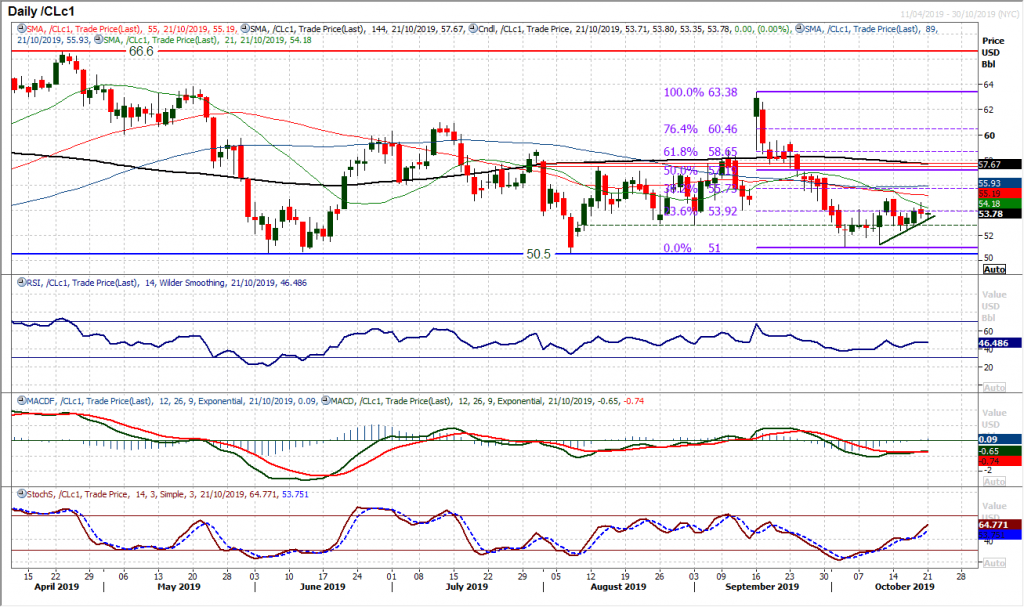
Oil is another market that has been a real slog in the past couple of weeks. False signals and lacking conviction, the market has developed into a range between the support at $51.00 and resistance at $53.95. Within that, the market appears to be drawn back repeatedly to a range between $52.85 and the 23.6% Fibonacci retracement of $63.40/$51.00 at $53.90. There is the sense that the hourly chart is showing a very slight positive bias now though and if the bulls can build with a positive candlestick today then there could be a degree of direction starting to pull in recovery. For now though, it is wait and see for confirmation/conviction.
Dow Jones Industrial Average
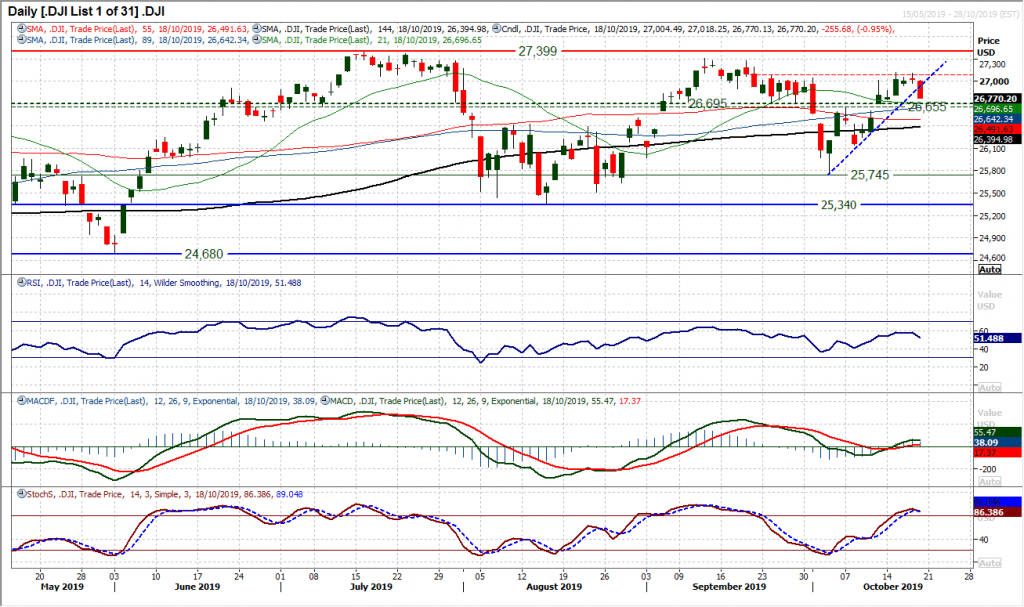
The stalled rally has now turned into reverse as a decisive and solid negative candle cut over -250 ticks off the Dow and broke a two week uptrend. For over a week now we have been talking about the importance of a breakout above the pivot band 26,655/26,695 and once more this comes in to be tested. This will be an important moment for the near to medium term outlook as if this pivot is now decisively breached it would suggest that the bulls have lost control and another retreat within what is now a medium term broad trading range between 25,340/27,399 will kick in. Momentum indicators are threatening to roll over again. RSI below 50 along with Stochastics bear crossing and MACD lines back under neutral would confirm the medium term range of c. 2050 ticks. The hourly chart shows resistance now 26,955/27,120.
Author

Richard Perry
Independent Analyst


