Brent Oil dipped to $56.16 last week, before rallying to a two-year high of $64.44 levels. The stellar rally is the result of the increased odds of the extension of the production cut deal. We have heard this reason before, however, it is slightly different this time...

The crackdown by Mohammed bin Salman (popularly known as MBS) is largely seen consolidating the Crown Prince's power.  But why did it bode well for Oil prices?

The Cartel meets on Nov. 30 in Vienna. On top of the agenda will be an extension of production cuts. MBS is known to favor an extension of production cuts, thus the crackdown yielded a big rally in Oil prices.

Furthermore, as stated by Jeffrey Halley from Oanda Asia-Pacific, the potential disruption of supplies in Iraqi Kurdistan, Libya and also forgotten in the noise, Venezuela, appears to have played a role in strengthening the bid tone around Oil prices.

So will the geopolitical rally in Oil prices continue? As per technical studies, there is scope for an extension of the ongoing rally to $66.50 levels, although the short-term prospects look grim, courtesy of the overbought indicators. A healthy pullback could yield a more sustained rally towards $66.00-$66.50 levels.

First, we take a look at the weekly chart, which shows:

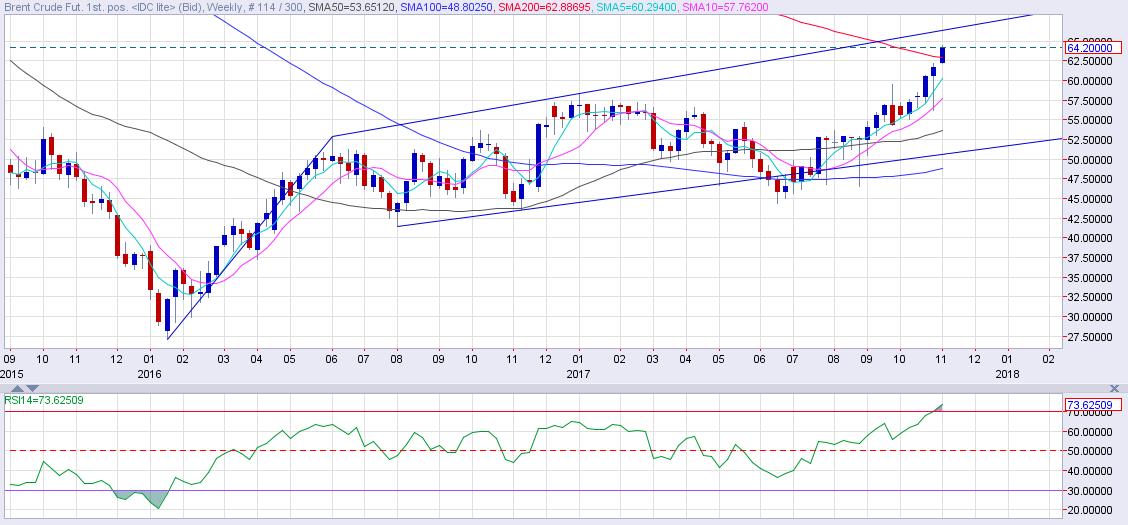
  • Flag & pole-like pattern: bullish continuation pattern
  • The RSI is overbought, calls for caution
  • 5-MA, 10-MA show bullish bias (sloping upwards)
  • 50-MA, 100-MA flatlined
  • 200-MA shows negative bias (sloping downwards)

The overbought conditions and the downward sloping 200-MA suggest there is merit in being cautious, although dips are likely to be capped between $60.29 (5-MA) and $57.76 (10-MA).

Coming to the daily chart, the price action remains in favor of the bulls, although in the short-term, oil looks vulnerable for a healthy technical pullback.

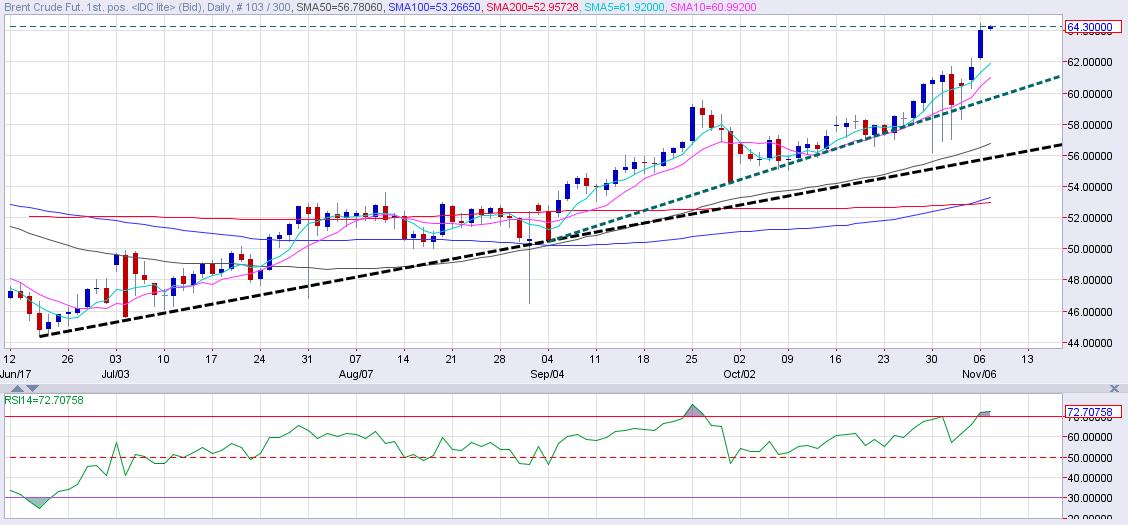
  • 5-MA, 10-MA sloping upwards.
  • 50-MA, 100-MA and 200-MA aligned one below the other, shows overall outlook remains bullish.
  • Solid higher lows pattern defined by rising trend lines (black, green).
  • RSI is overbought.

A corrective move to $60.00 cannot be ruled out, however, the position of the moving averages and the higher lows pattern indicates the dip is likely to be short-lived. Only an end of the day close below the green trend line would abort the bullish view on the daily chart. On a larger scheme of things, a break below $56.00 (black trend line) would signal a trend change.

To cut the long story short, the base appears to have shifted higher to $57-$60 range. The doors remain open for a rally to $66.50 levels, albeit after a healthy technical pull back.

Information on these pages contains forward-looking statements that involve risks and uncertainties. Markets and instruments profiled on this page are for informational purposes only and should not in any way come across as a recommendation to buy or sell in these assets. You should do your own thorough research before making any investment decisions. FXStreet does not in any way guarantee that this information is free from mistakes, errors, or material misstatements. It also does not guarantee that this information is of a timely nature. Investing in Open Markets involves a great deal of risk, including the loss of all or a portion of your investment, as well as emotional distress. All risks, losses and costs associated with investing, including total loss of principal, are your responsibility. The views and opinions expressed in this article are those of the authors and do not necessarily reflect the official policy or position of FXStreet nor its advertisers. The author will not be held responsible for information that is found at the end of links posted on this page.

If not otherwise explicitly mentioned in the body of the article, at the time of writing, the author has no position in any stock mentioned in this article and no business relationship with any company mentioned. The author has not received compensation for writing this article, other than from FXStreet.

FXStreet and the author do not provide personalized recommendations. The author makes no representations as to the accuracy, completeness, or suitability of this information. FXStreet and the author will not be liable for any errors, omissions or any losses, injuries or damages arising from this information and its display or use. Errors and omissions excepted.

The author and FXStreet are not registered investment advisors and nothing in this article is intended to be investment advice.

Recommended Content


Recommended Content

Editors’ Picks

How will US Dollar react to Q1 GDP data? – LIVE

How will US Dollar react to Q1 GDP data? – LIVE

The US' GDP is forecast to grow at an annual rate of 2.5% in the first quarter of the year. The US Dollar struggles to find demand as investors stay on the sidelines, while waiting to assess the impact of the US economic performance on the Fed rate outlook. 

FOLLOW US LIVE

EUR/USD holds gains above 1.0700, as key US data loom

EUR/USD holds gains above 1.0700, as key US data loom

EUR/USD holds gains above 1.0700 in the European session on Thursday. Renewed US Dollar weakness offsets the risk-off market environment, supporting the pair ahead of the key US GDP and PCE inflation data. 

EUR/USD News

GBP/USD extends recovery above 1.2500, awaits US GDP data

GBP/USD extends recovery above 1.2500, awaits US GDP data

GBP/USD is catching a fresh bid wave, rising above 1.2500 in European trading on Thursday. The US Dollar resumes its corrective downside, as traders resort to repositioning ahead of the high-impact US advance GDP data for the first quarter. 

GBP/USD News

Gold price edges higher amid weaker USD and softer risk tone, focus remains on US GDP

Gold price edges higher amid weaker USD and softer risk tone, focus remains on US GDP

Gold price (XAU/USD) attracts some dip-buying in the vicinity of the $2,300 mark on Thursday and for now, seems to have snapped a three-day losing streak, though the upside potential seems limited. 

Gold News

XRP extends its decline, crypto experts comment on Ripple stablecoin and benefits for XRP Ledger

XRP extends its decline, crypto experts comment on Ripple stablecoin and benefits for XRP Ledger

Ripple extends decline to $0.52 on Thursday, wipes out weekly gains. Crypto expert asks Ripple CTO how the stablecoin will benefit the XRP Ledger and native token XRP. 

Read more

Majors

Cryptocurrencies

Signatures