The most intriguing technical situation on the Brent Oil chart is currently unfolding. One comprehensive chart covering the past few months encompasses nearly all major price action principles.

To begin with, we observe that Brent Oil is firmly entrenched in a downtrend, which was briefly interrupted by a bullish correction. This correction took the form of a wedge pattern, reaching a local peak with a false breakout above the 38.2% Fibonacci level. However, the bullish momentum abruptly came to an end yesterday with the breakdown of the lower boundary of the wedge, triggering a decisive and uninterrupted decline.

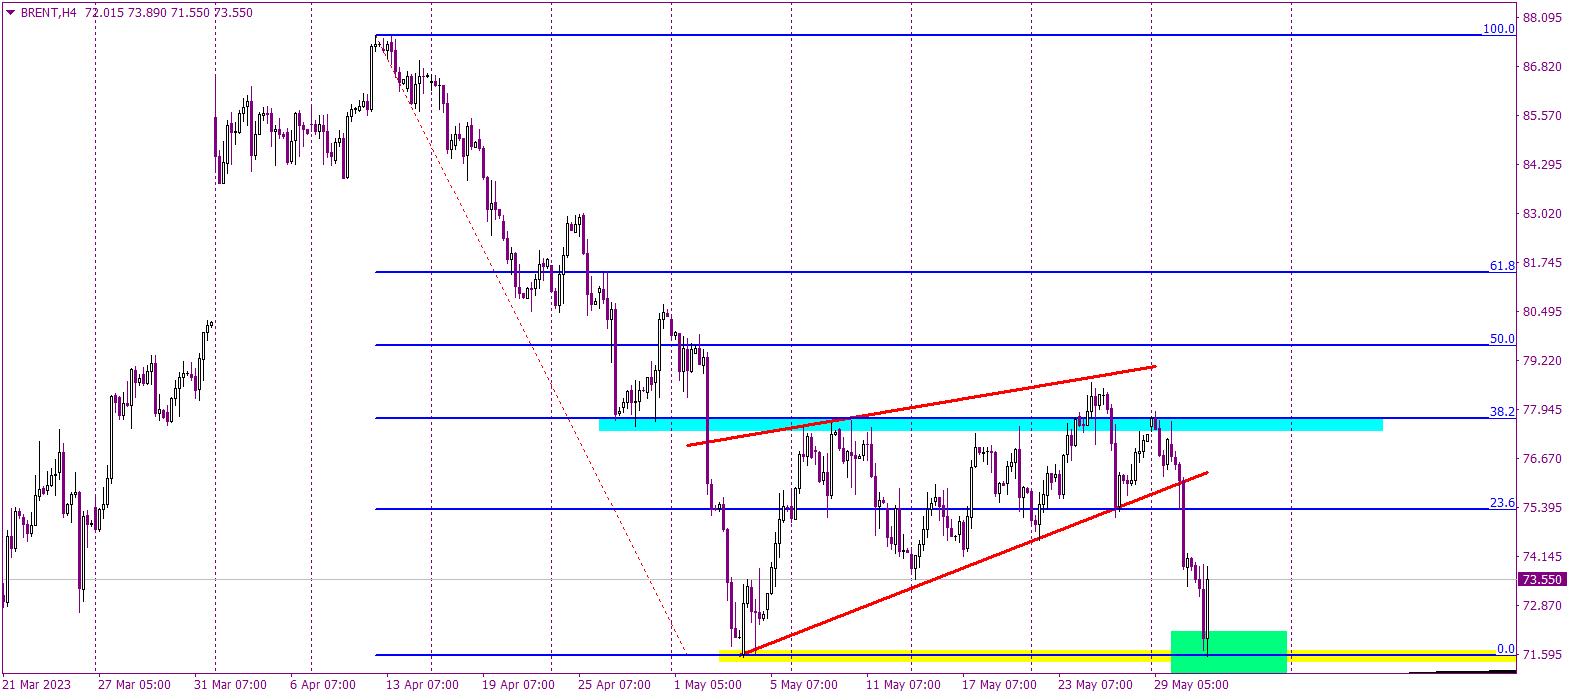
Despite the sharp drop, it eventually found support at a significant long-term level established in early May. Currently, we are witnessing a bounce, which holds great potential for the formation of a double bottom pattern, indicating a possible major reversal. However, it remains uncertain whether this bounce will materialize into a full-fledged reversal, as its fate is still being determined. The situation can be summarized as follows: a breakout of the yellow support will certainly serve as a buy signal, while a price climb back above the 23.6% Fibonacci level can confirm the formation of a double bottom and act as a signal to enter a long position.

Trading FX/CFDs on margin bears a high level of risk, and may not be suitable for all investors. Before deciding to trade FX/CFDs you should carefully consider your investment objectives, level of experience, and risk appetite. You can sustain significant loss.

Recommended Content


Recommended Content

Editors’ Picks

EUR/USD climbs to 10-day highs above 1.0700

EUR/USD climbs to 10-day highs above 1.0700

EUR/USD gained traction and rose to its highest level in over a week above 1.0700 in the American session on Tuesday. The renewed US Dollar weakness following the disappointing PMI data helps the pair stretch higher.

EUR/USD News

GBP/USD extends recovery beyond 1.2400 on broad USD weakness

GBP/USD extends recovery beyond 1.2400 on broad USD weakness

GBP/USD gathered bullish momentum and extended its daily rebound toward 1.2450 in the second half of the day. The US Dollar came under heavy selling pressure after weaker-than-forecast PMI data and fueled the pair's rally. 

GBP/USD News

Gold rebounds to $2,320 as US yields turn south

Gold rebounds to $2,320 as US yields turn south

Gold reversed its direction and rose to the $2,320 area, erasing a large portion of its daily losses in the process. The benchmark 10-year US Treasury bond yield stays in the red below 4.6% following the weak US PMI data and supports XAU/USD.

Gold News

Here’s why Ondo price hit new ATH amid bearish market outlook Premium

Here’s why Ondo price hit new ATH amid bearish market outlook

Ondo price shows no signs of slowing down after setting up an all-time high (ATH) at $1.05 on March 31. This development is likely to be followed by a correction and ATH but not necessarily in that order.

Read more

Germany’s economic come back

Germany’s economic come back

Germany is the sick man of Europe no more. Thanks to its service sector, it now appears that it will exit recession, and the economic future could be bright. The PMI data for April surprised on the upside for Germany, led by the service sector.

Read more

Majors

Cryptocurrencies

Signatures