Brent: after the decision of OPEC

Trading recommendations
Sell ​​Stop 51.35. Stop-Loss 52.10. Take-Profit 51.10, 50.70, 50.00, 48.20, 47.25
Buy Stop 52.70. Stop-Loss 51.80. Take-Profit 53.00, 53.70, 55.60
Technical analysis
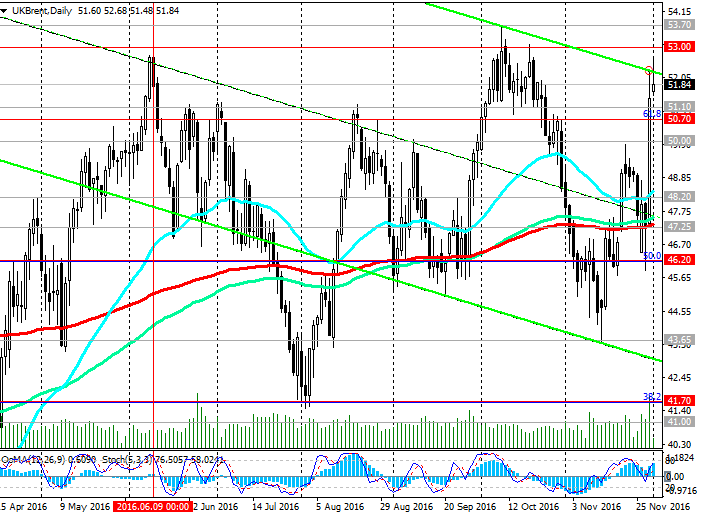
Yesterday, oil prices have soared by 10% to new highs in the last 5 weeks. The price of Brent crude rose to marks near the level of 52.45, the upper boundary of the newly formed downtrend channel on the daily chart.
During the European session, there is a decrease from highs on profit oil market participants.
Indicators OsMA and Stochastic on the daily, weekly, monthly schedules are on the side of buyers, however, on the 4-hour and 1-hour charts - move to the side of the sellers.
As a result of yesterday's strong growth in the price rebounded from the key support level of 47.25 (EMA200 on the daily chart), breaking the resistance level of 48.20 (EMA50 daily chart). However, the absolute annual and October highs near the mark of 53.70 achieved yet were not.
It appears that the price has formed a new range between the levels of 50.70 (Fibonacci level 61.8% decrease from the level of 65.30 to lows near the 2016 mark of 27.00) and 53.70.
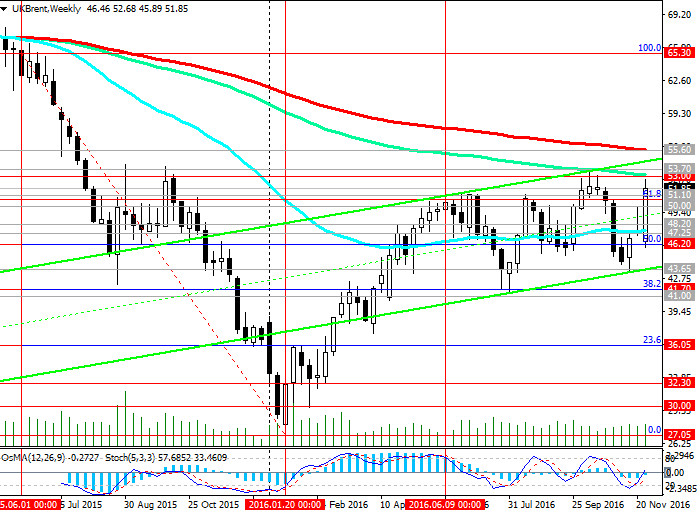
In the case of upward momentum and break the upper limit of the range at 53.70 price will go to the resistance level of 55.60 (EMA200 on the weekly chart) within a week of the rising channel.
Nevertheless, rising in price the dollar, and the current oversupply of oil in the world will restrain the growth of oil prices.
In case of breakdown of support levels 50.70, 50.00 prices will return to the levels of support 48.20, 47.25.
The breakdown of the level of 46.20 (50.0% Fibonacci level) will cause a further decline in the descending channel on the daily chart with the targets 43.65, 41.70 (Fibonacci level of 38.2%). Breakdown level 41.70 (38.2% Fibonacci level and the lows of July / August), may lead to the beginning of a new wave of lower oil prices.
Support levels: 51.10, 50.70, 50.00, 48.20, 47.25, 46.20, 44.30, 43.65, 41.70, 41.00
Resistance levels: 53.00, 53.70, 55.60
Overview and Dynamics
Yesterday quotes of Brent oil surged above $ 52 a barrel after OPEC agreed to reduce the total oil production by 1.2 million barrels, which is equivalent to about 1% of world oil production.
The deal was the first successful attempt to reduce oil production since 2008 and has led to an increase in oil prices on Wednesday, more than 10%.
Significant reductions will take place, Saudi Arabia, the most influential member of the cartel. February futures for Brent oil rose by 0.72% to 52.91 dollars per barrel, the highest level in more than five weeks.
Spot price for Brent crude yesterday reached the level of 52.30 dollars per barrel, and today the maximum has been upgraded to the level of 52.45. However, at the beginning of the European session today, there is a correction to profit-taking, but the price is still holding above the 51.10 level (July, August highs).
Now the main issue is the implementation of the agreement of the cartel participants. Earlier, the cartel members have violated the agreement and exceeded the quota set for the extraction.
Agreement to limit oil production, of course, will be the main driver in the dynamics of oil prices. However, excess of supply over demand is still on the agenda. In the United States increases the number of active drilling rigs, as the new US president Donald Trump promises to lift the restrictions on the production of energy in the United States.
It is highly probable that achieved yesterday and today, highs are unlikely to be "rewritten", and very soon, it is possible that this week, the price returns below 50.00 dollars per barrel of Brent, and will reverse the downward oil price movement.
*)presented material expresses the personal views of the author and is not a direct guide to conduct trading operations
Oil Current Trading Positions
Author

Yuri Papshev
Independent Analyst
Independent trader and analyst at Forex market. Trade experience - more than 10 years. In trade Yuri Papshev uses a combination of fundamental and technical analysis.


