Bitcoin Futures tested 23.6% Fibonacci retracement while gold/silver ratio advanced

Market Recap
|
Market Recap |
% |
Close Price |
|
GER30(Mar.2018) |
0.76% |
13,259.00 |
|
GBPUSD |
0.46% |
1.3894 |
|
EURUSD |
0.43% |
1.2238 |
|
USDCHF |
-0.72% |
0.9589 |
|
USDTRY |
-1.32% |
3.7681 |
|
USDZAR |
-1.36% |
12.1314 |
Prices as of previous day instrument closing.
-
US indices closed in negative territory with light losses. The DJIA slid 97.84 points or 0.37% and closed at 26,017.81 while the S&P500 dropped 4.53 points or 0.16% to 2,798.03. Nasdaq Composite lost 0.03% or 2.23 points to 7,296.04. In Europe the DAX rallied to 13,281.43, up 97.47 points or 0.74% and in Japan the Nikkei closed at 23,808.06, up 44.69 points or 0.19%.
-
In the FX market EURUSD rose 0.42% to 1.2238 and GBPUSD closed at 1.3894, up 0.45%. USDJPY slid 0.16% to 111.11 and USDCHF dropped 0.72% to 0.9589. the US Dollar index closed at 90.49, down 0.05% and US 10 year T-Note yield rallied 1.35% to 262 basis points.
-
Gold closed at 1,327.03 $/oz, up 0.01% while silver dropped 0.25% to 16.95 $/oz.
Charts of the day
Gold and Silver ratio
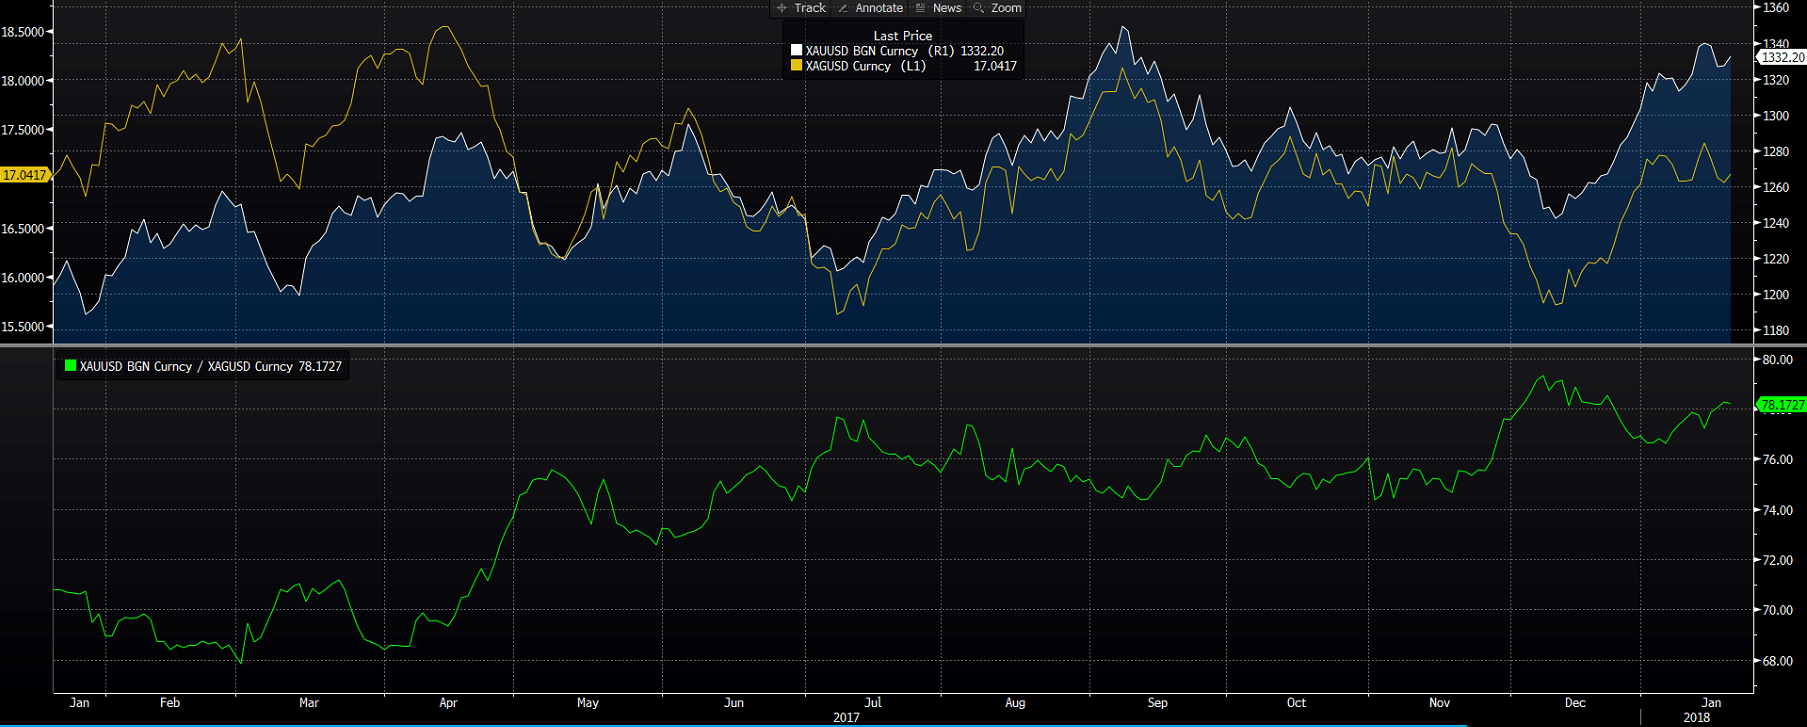
Precious metals rallied since their December lows and XAGUSD outperformed XAUUSD. This month however silver was more weak than the shiny metal and the ratio has increased.
XAUUSD (Weekly Chart)
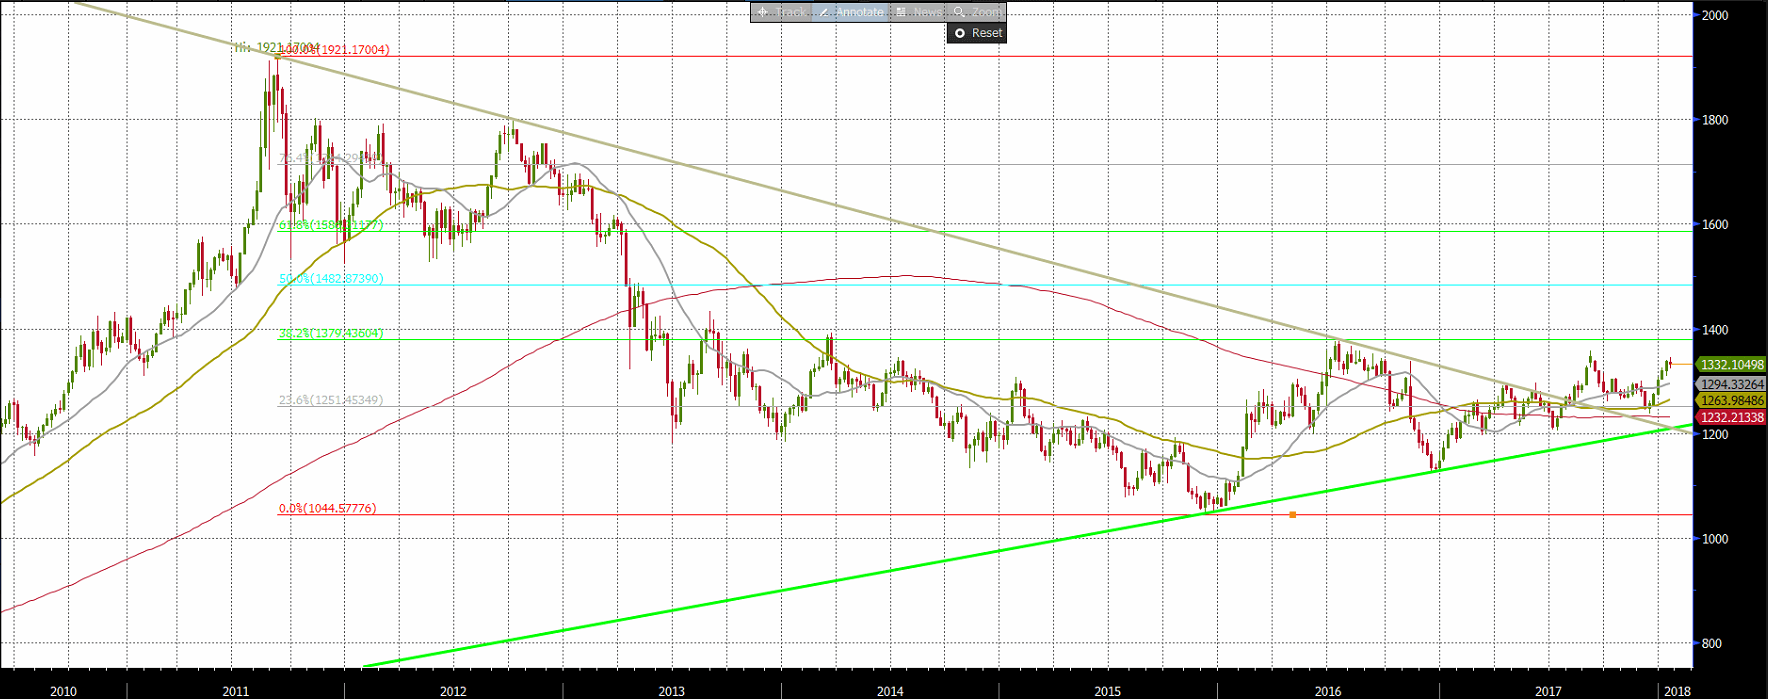
The commodity is making higher lows after the multiyear low reached in December 2015 at 1,044.47 $/oz. The commodity retraced only 38.2% of the selling wave generated at 1,921.17 $/oz triggered in 2011. The shiny metal also broke the supply line that links lower highs but is likely to see another bullish wave above its 2016 high 1,379. Beneath 1,200 $/oz market sentiment could deteriorate and the commodity it may retrace to 1,134 and then to 1,044.
XAGUSD (Weekly Chart)
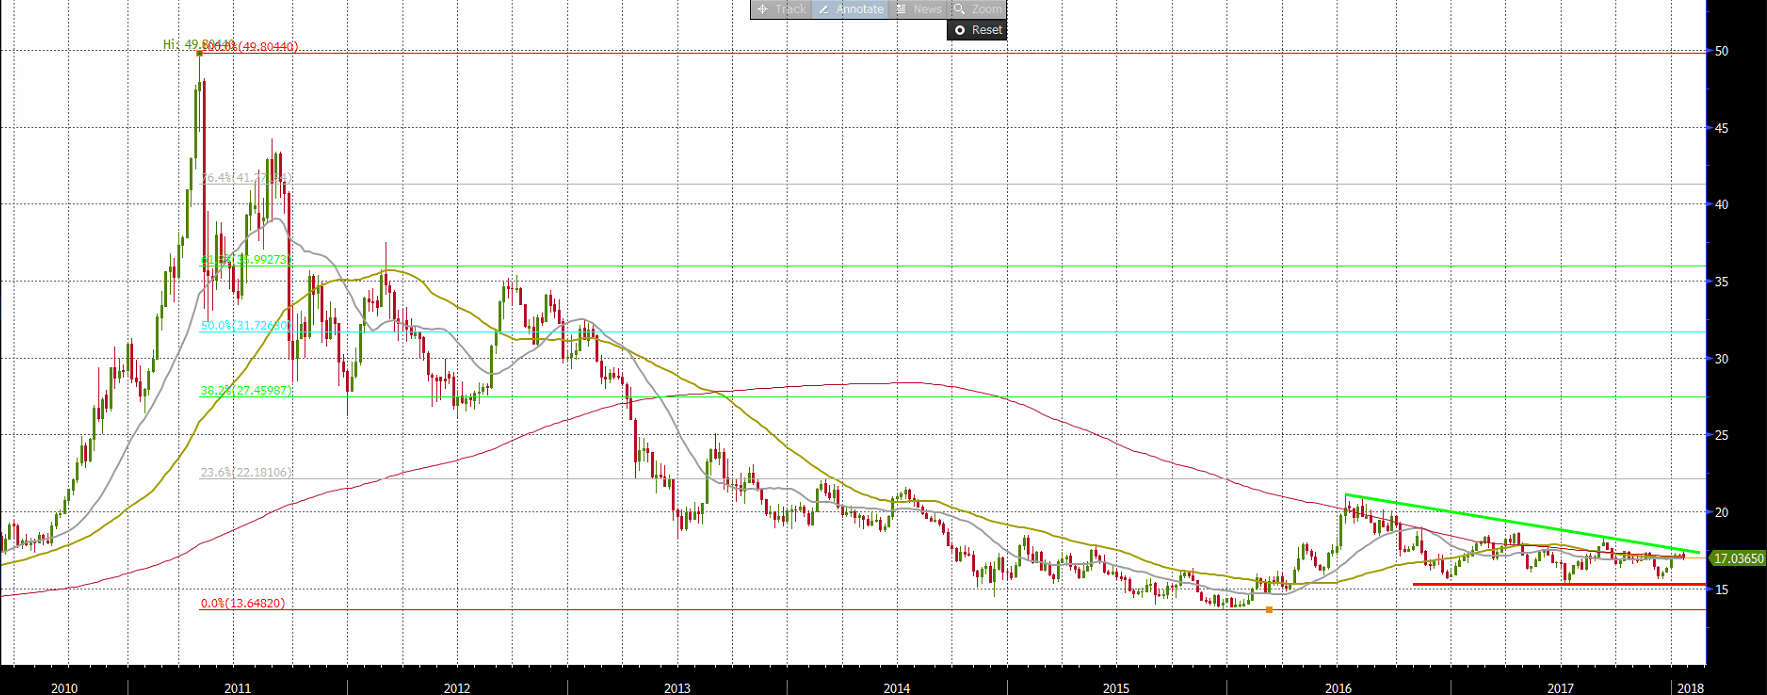
After the commodity reached 49.8 $/oz in 2011 it went in a multiyear bear market and reached 13.64 $/oz between December 2015 and January 2016. After a rally it developed again lower highs and there is a static support in area 15.3 $/oz. Silver has not retraced yet even the 23.6% of its bearish wave.
Economic Calendar
|
Friday January 19, 2018 CET Time |
Forecast |
Previous | ||
|
08:00 |
EUR |
German PPI (MoM) (Dec) |
0.2% |
0.1% |
|
08:00 |
EUR |
German PPI (YoY) (Dec) |
2.3% |
2.5% |
|
10:30 |
GBP |
Core Retail Sales (YoY) (Dec) |
3.0% |
1.5% |
|
10:30 |
GBP |
Core Retail Sales (MoM) (Dec) |
-0.8% |
1.2% |
|
10:30 |
GBP |
Retail Sales (MoM) (Dec) |
-0.6% |
1.1% |
|
10:30 |
GBP |
Retail Sales (YoY) (Dec) |
3.0% |
1.6% |
|
18:15 |
USD |
Fed's Quarles speech |
|
|
The European session will kick off with the German PPI data at 08:00 CET followed by UK Retail Sales data at 09:30 GMT. During the US session will be released the Michigan Consumer sentiment Index at 16:00 CET and then Randal Keith Quarles, member and vice Chair of the Federal Reserve Board of Governor, will hold a speech. Before the opening bell Schlumberger and Sun Trust Bank in US will release their quarterly earnings.
Technical Analysis
EURUSD (Daily timeframe)
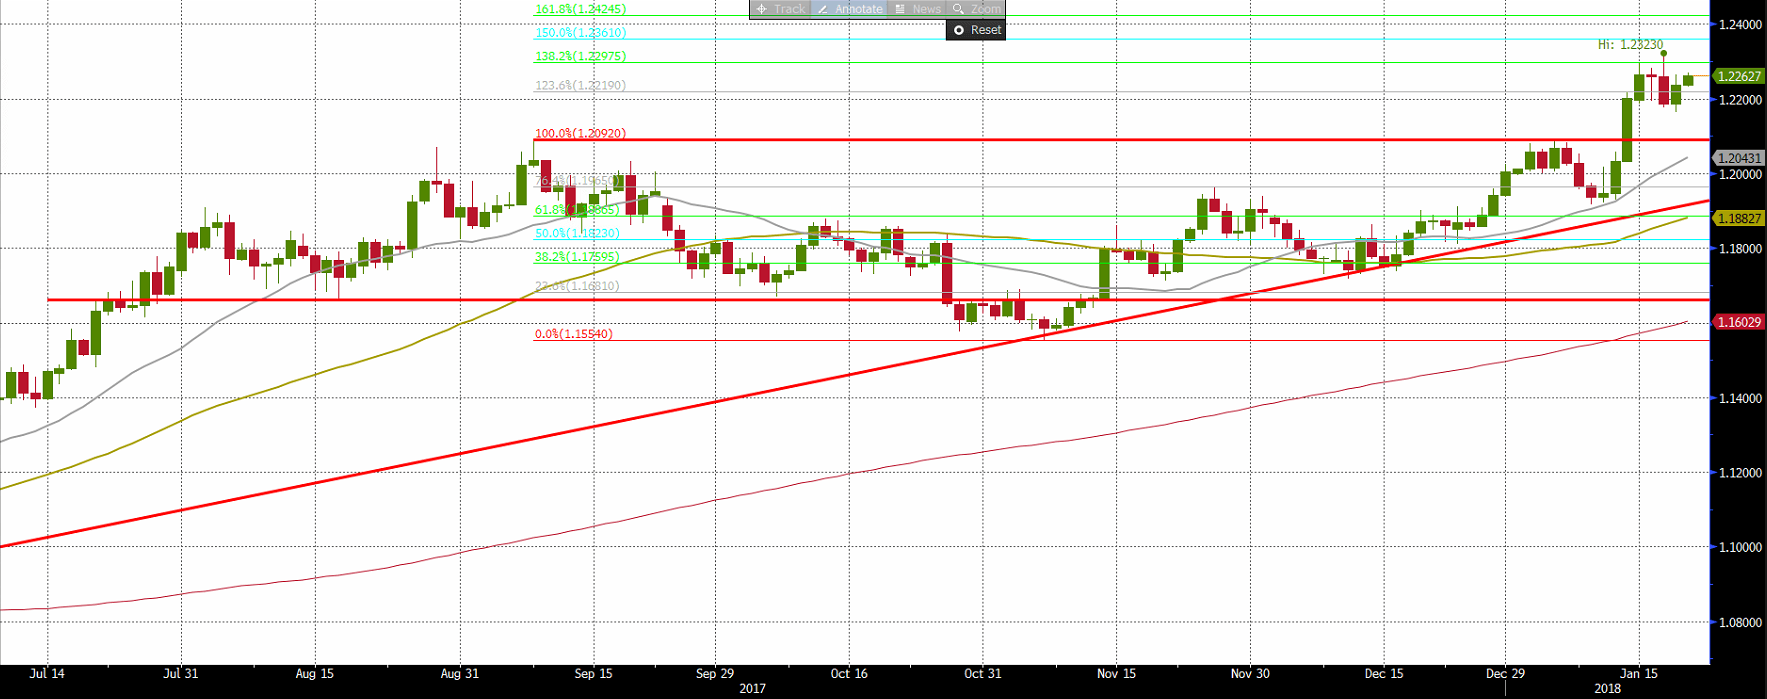
EURUSD is off its 2018 high 1.2323 and a breakout of this level it may lift the rate to 1.2425 and then near area 1.26, where there is a multiyear supply line that links lower highs generated when EURUSD was trading at 1.60 in 2008. Beneath 1.2160 EURUSD it may retrace to 1.2092 but only beneath the bullish trendline the rate could have a more severe retracement.
BTCUSD Futures (Daily timeframe)
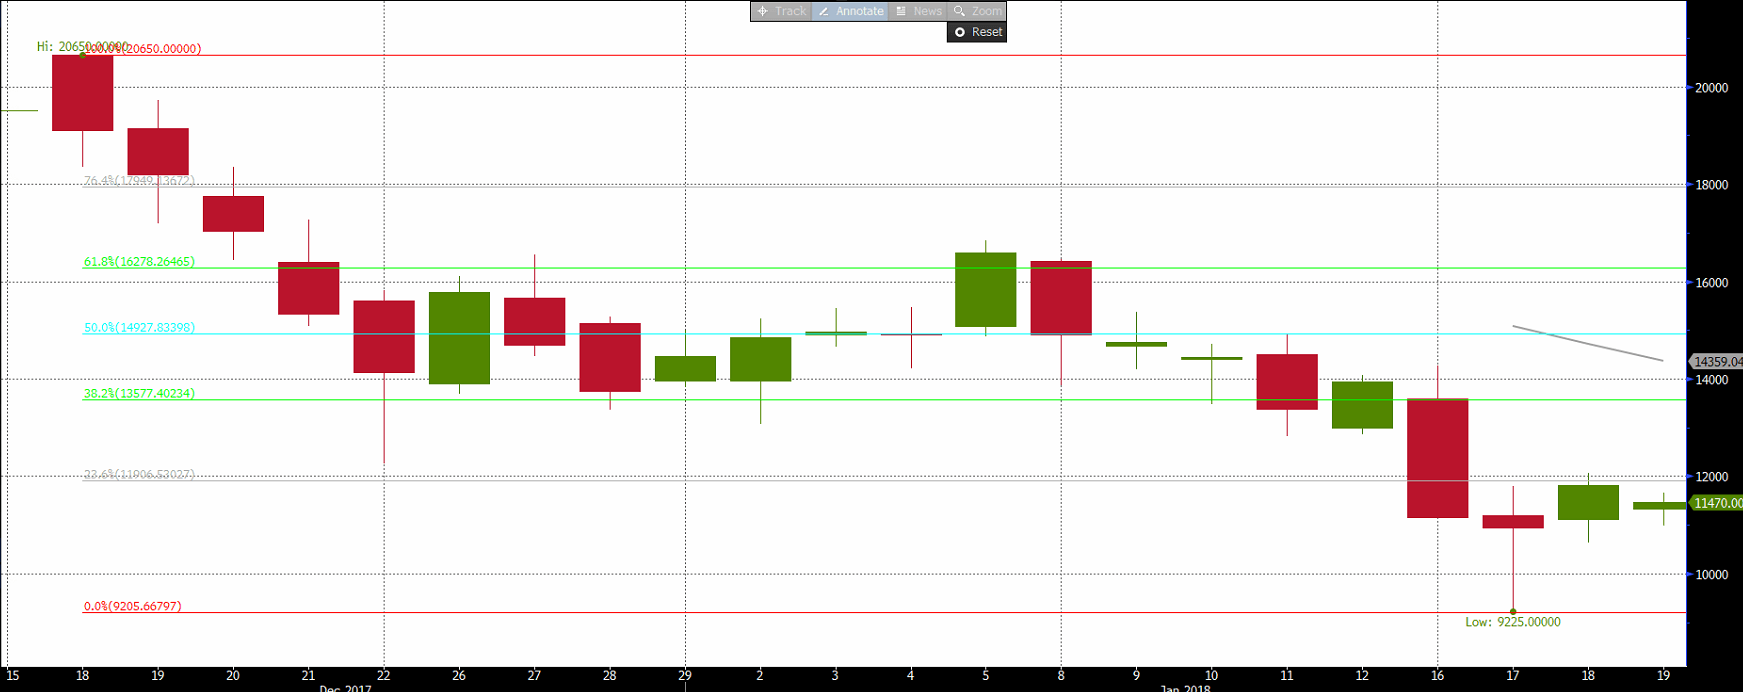
The Future contract on the digital asset Bitcoin is struggling to rise above the 23.6% Fibonacci. Another selloff wave could bring Bitcoin Futures to test 9,225 while above 12,000 the digital asset could rally to 13,577.
Author

ALB Team
ALB Forex Trading
ALB Research Department is the research department of ALB Forex Trading Ltd.


