Big Data Applications in the Economics/Financial World Part I: Opportunities and Challenges

Executive Summary
Exploring complex interactions between different sectors or individual agents is an integral part of an effective decision-making process. Accurate estimations of the relationships between sectors of an economy can help decision makers to (a) evaluate the effectiveness of existing policies more precisely and (b) design appropriate policies for the immediate future. Big data has the potential to identify the information diamond-in-the-rough.1 Analysts can include very useful real world information in their models to characterize different economic agents' behavior instead of solely making assumptions about their behavior.
This report serves as a primer on big data applications and their potential utilization in the economics/financial world. We highlight the benefits and challenges of big data applications for economists, financial analysts and decision makers. This report also outlines a framework to help analysts utilize big data in economics and finance. We sketch potential applications for decision makers to help estimate the behavior of an economy/sector and economic agents and hence design appropriate policy tools.
In our view, the potential benefits of big data applications are enormous and big data could help analysts solve many modern day puzzles, such as productivity growth and its living standard relationship, micro-foundations of macroeconomics models, consumer/firm/investor behavior and many more. In addition, big data would help include what is often the missing link of demographics in many economic/financial theories, such as the consumption function, Beveridge curve, etc. For instance, the current consumption function employed to analyze consumers' behavior estimates an average behavior that does not distinguish consumers' behavior by demographic or geographic region. Another potential utilization of big data would be to improve current methods to estimate the state of the overall economy as well as different sectors'/regions' performances. For the financial world, big data would increase opportunities for profits and help manage risk more efficiently by incorporating broader information in risk modeling.
Of course, first we have to bake the cake before we eat it. There are several challenges that need to be addressed to profit from big data. One current issue is that traditional statistical tools are not fully and/or accurately able to handle the volatility related to big data. Standard statistical tests, which help us to draw inferences, are not well equipped to apply to big data (due to a shorter time span, greater volatility and a large number of observations).
In sum, we believe, once we design statistical tools capable of effectively handling big data, that big data will increase our understanding of the behavior of economic agents and complex economic and financial systems and hence dramatically improve decision making. In this report, we provide some potential applications of big data and, in a second report, we will talk about possible statistical frameworks to grapple with big data.
What Is Big Data?
What is big data, and how is it different from traditional data? Put simply, big data is significantly large in volume, with potentially billions of observations and often at a very high frequency. We highlight three major ways in which big data differs from traditional economic/financial data.
-
First, the sample size of big data is often larger than a traditional dataset. A good example is credit/debit card transaction data, which could include millions of data points.
-
Second, in some cases, the frequency of big data is not fixed and is often available in an ultra-high frequency (minute-by-minute per transaction or click-by-click on a website). Traditional data is typically released at a fixed interval of months or quarters.
-
Third, the sources of big data are not fixed and the data consist of a different number of respondents over time. Traditional data, by comparison, often includes a similar number of respondents (from a survey for example) each month.
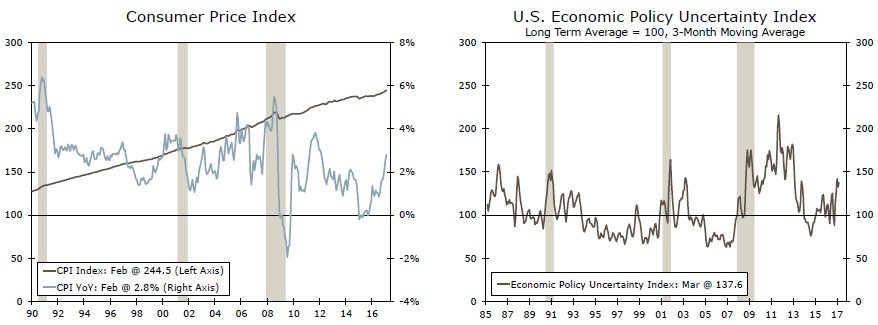
Essentially, big data may consist of billions of observations, from millions of entities at an ultrahigh frequency. One well-known example of big data in macroeconomics is MIT's Billion Prices Project (BPP). The BPP collects prices from hundreds of retailers to construct a price measure, or inflation index.2 BPP research suggests that the BPP price index is a good measure for predicting the overall U.S. inflation rate (Figure 1). Another big data application is the use of ATM/POS (point-of-sale) data to forecast private consumption, which some studies suggest is a good predictor of private consumption.3 The construction of the Economic Policy Uncertainty Index using text-mining along with traditional indicators is another useful example.4 The index is widely considered a reliable measure of policy uncertainty (Figure 2).
Opportunities for Economics/Finance and Decision Makers
Big data analytics is starting to pave the way for analysts to conduct in-depth empirical analysis and hence provide better insight for decision makers. One example of big data's application is a recent study by Farrell and Greig (2016). They estimate the effect of falling oil prices on personal spending.5 Farrell-Greig utilize one million out of 57 million JP Morgan Chase regular debit and credit cards customers' data, and their estimates suggest that middle-income households, on average, spent about $480 less on gas in 2015 than in 2014. The Farrell-Greig study is an excellent example of big data's utilization to enhance our understanding of the behavior of economic agents.6
As we can see, analysts have already started to utilize big data in economics and finance. In the following sections, we outline some potential applications of big data for future research. We divide potential big data applications into two groups, (1) big data utilization in economic/financial modeling and (2) measuring the state of a sector's/region's/demographic group's performance.
How Might Big Data Affect Economic/Financial Modeling
Decision makers around the globe utilize large-scale macroeconomic models (sometimes known as macro-econometric models) to conduct policy analysis on the potential effect of an interest rate hike on the economy for example.7 Most of these models utilize a "bottom up" approach (also called micro-foundations of macroeconomics) that models the behavior of economic agents at the individual level, at least theoretically.8 Furthermore, these models estimate the "average" behavior of agents to draw inferences for decision making.
In our view, big data can make significant improvements in macroeconomic modeling practices by providing more detailed information and hence more effective decision making. For example, at present, most macroeconomic models utilize either theoretical foundations (no or minimum real world data) or aggregate macroeconomic data (aggregate private consumption, for example). Both approaches limit effective decision making as one lacks real world data and the other uses the average behavior, such as whether aggregate consumption has gone up or down (Figure 3).
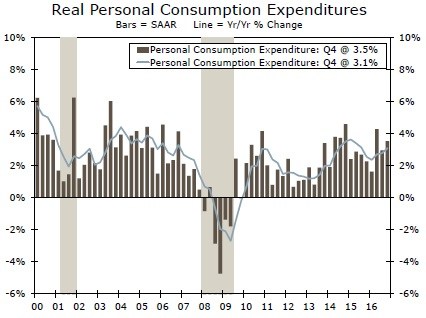
With big data, in the near future analysts could incorporate individual level data and characterize spending behavior by gender, generation, region, income and other characteristics by including actual spending data from hundreds of millions consumers. Furthermore, based on spending patterns, analysts would be able to identify consumers with similar preferences/behavior and model consumption behavior based on these patterns. Since consumption is the single-largest component of the overall economy, understanding consumers at the micro level in great demographic detail would help decision makers to design appropriate policy tools or make evidence-based business decisions.
More timely and descriptive data would provide significant research benefits. In our research, we have written two separate series on Millennials and the Baby Boomers and their effects on the economy in the years ahead. Finding timely data with a demographic component, however, often proved to be one of our biggest challenges. For example, the U.S. Department of Commerce publishes U.S. consumption data on a monthly and quarterly basis. Like many monthly/quarterly releases, however, it is aggregate data, meaning there is little to no information regarding spending by income levels, gender, age, etc. To obtain spending data at that level of detail, we often turned to the Consumer Expenditure Survey from the Bureau of Labor Statistics. This survey, although rich in detail, is performed just once a year, meaning we often faced at least a one-year lag in the data. In a rapidly evolving and changing economy, more timely data beyond the aggregate would prove highly valuable to researchers and decision makers.
Firm/Investor Decisions
Another major component of a standard macroeconomic model includes decisions by firms and investors. Most models in practice follow the approach for firm/investor behavior akin to consumers, either using minimal data (only theoretical models) or aggregate data (business fixed investment, Figure 4, for example). Many firms, at least in the United States, keep electronic records of most transactions (input/output prices, number of employees, wages, profit/loss, sales revenue, etc.), and, in our view, in the near future those transactions could be utilized in econometric models. Analysts using big data would be able to model individual firm's behavior and characterize a firm's behavior according to its size, region and preferences within and between different sectors. At present, most analysts do not incorporate individual firm level data in their macroeconomic models and rely either on more traditional theoretical models or aggregate data that limit the understanding of firm behavior. Big data, on the other hand, would provide an opportunity to include individual firm level data and enhance our understanding about firm/investor behavior that would prove useful information for decision makers.

The Great Recession forced analysts to include the financial sector in macroeconomic models, as before the recession not many models took into account the importance of financial sectors to the overall economy. The financial sector insertion into macroeconomic models is still at a relatively early stage and most models rely on theoretical foundations of the financial sector (meaning no real world data).9 The financial sector, in our view, is among the first major sectors that has the potential to utilize big data and gain valuable insight. One major reason is that most activities in the financial world are recorded electronically and a longer history of those activities is often available. For example, individual company's trading/sales activities and earnings reports are recorded regularly and have a rich history. Furthermore, in the financial sector, there are thousands of companies of all sizes and with different business models and goals. Therefore, financial analysts who now are relying on theoretical foundations, in the near future, could utilize big data to characterize financial sector behavior as well as sub-sectors within the financial world.
It would be possible to characterize individual institutions into similar preferences (business models) as well as major financial world agents' behavior (traders, investors, brokers, etc.) by employing big data. For instance, a rich history of the companies listed in the S&P 500 is available and can be utilized to characterize companies' behavior. That is, companies could be divided into groups using their size/location/industry/business model and then the effect of a change in interest rates (or another shock) can be estimated for these different groups. The major benefit of this grouping using big data is that the effect of a change in interest rates would be anticipated to be different for different groups. Furthermore, instead of estimating and using the average effect on the financial sector, estimating the company or group specific effect would provide more insight for decision makers. In addition, big data would also help to characterize which companies are leading/lagging and/or more sensitive to a policy change. Therefore, big data would help analysts to include financial sector in macro models accurately.
In sum, using big data, analysts can incorporate more information in the modeling phase, and the sector specific big data may help improve forecast accuracy for the overall sector's performance as well as other sectors and the aggregate economy.
The Potential Rewards for Big Data Modeling Are Enormous
As mentioned earlier, big data has the potential to identify the information diamond-in-therough. Analysts can include very useful real-world information in their models to characterize different economic agents' behavior instead of solely making assumptions about their behavior. In addition, the benefits of big data go beyond the individual agent/sector's characterization. In our view, big data would help analysts explore complex links among major sectors and economic agents that would provide bases for effective decision making. We provide a detailed discussion of the potential utilization and benefits of big data modeling in the following section.
Exploring complex interactions between different sectors or agents is an integral part of an effective decision-making process. An accurate estimation of the relationship between sectors of an economy can help decision makers (a) evaluate the effectiveness of existing policies more precisely and (b) design appropriate policies for the future.
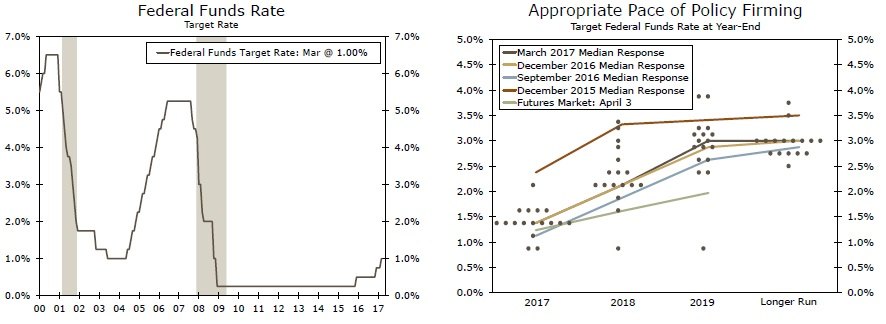
Decision makers, such as the members of the Federal Open Market Committee (FOMC), could utilize big data to help determine the appropriate stance of monetary policy. For example, at present, the FOMC is in the process of monetary policy normalization—increasing the target for the fed funds rate (Figure 5). The FOMC has a vital interest in analyzing and understanding the potential effect of a rate hike on the economy. This helps the FOMC to determine the path of the fed funds rate in the near future (Figure 6).10 Big data could provide greater insight to the FOMC and help estimate the potential effect of a rate hike on different sectors of the economy. Instead of just using aggregate consumption data, the FOMC could utilize individual level data not just for total consumption but also for mortgage & auto loans, changing spending patterns throughout the business cycle by demographic subsectors, etc. For example, consumers' response to a rate hike can be estimated using credit/debit card transactions (reflecting regular spending behavior), durables goods spending (possibly reflecting changes in longer-term spending behavior) and mortgage applications. Consumers' actions could then be characterized along these dimensions with respect to demographic or regional trends, helping the FOMC understand how higher rate hikes might affect different groups as opposed to just private consumption as a whole.
It would be helpful for the FOMC to estimate the potential effect of a rate hike on different sectors (economic agents) of the economy. However, the action of an economic agent affects other economic agents. It is through this mechanism that a rate hike decision by the FOMC produces a chain-reaction in the economy. Put differently, in response to a rate hike, consumers may push back on big-ticket items such as a new car or home. In response to slower demand, auto/construction/housing industries may reduce hiring or investment. The financial sector, which offers auto loans and mortgages, may also be affected by the slowdown in consumer spending, as would other industries such as leisure & hospitality that rely on a healthy labor market. With this simple but intuitive example, we want to stress that the effect a rate hike decision (or any major decision from the FOMC) would be distributed over time and spread through different sectors, highlighting the importance of effective decision making.
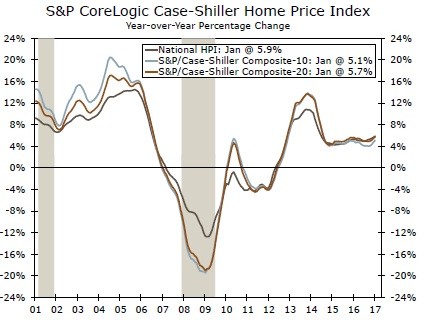
Sector or region specific estimations provide a more complete picture of the potential impact of monetary policy. There can often be serious consequences as activities in some sectors or regions permeate through to the overall economy. A great illustration of this scenario is the financial crises and the Great Recession. The housing boom was initially thought to be a regional phenomenon and did not pose a serious risk to the national economy. FOMC transcripts from this period show that at first the FOMC considered there to be regional housing bubbles and by 2006 the meeting transcripts show that Bernanke discussed that falling home prices may not derail economic growth (Figure 7).11
The same is true for a fiscal policymaker trying to estimate the effect of a tax change (or any other decision) on consumers and corporations. The effect of a tax change should be estimated for the overall economy as well as for different income groups/demographic groups/regions of the country/etc., a daunting task potentially made easier by big data. The Internal Revenue Service (IRS) has a rich history of data through tax filings for individuals and corporations. IRS data can shed light on many aspects of consumers and corporations. For example, Chetty et al. (2014) utilized IRS data for more than 40 million children and their parents to estimate intergenerational mobility in the United States.12 They estimated the income mobility for different income groups and for different locations (city, state etc.). Their study helps decision makers to design appropriate policies to improve intergenerational mobility. Furthermore, different policies are needed for different locations, income groups and demographic segments of the population, and thereby aggregate or average estimation may not be as helpful when designing policies to improve the chances of upward mobility.
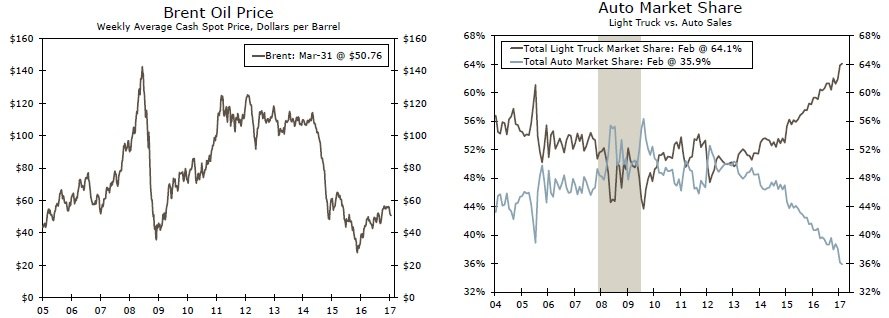
For private sector decision makers, at large institutions in particular (multinationals or bank holding companies, for example), it is vital to estimate reliable interactions among subcompanies/ sectors and sub-companies/consumers. A bank holding company is an example of a business that is spread over multiple sectors and involves different economic agents' activities. For example, XYZ (a fictional large financial institution) deals with consumers (mortgages/auto loans and credit cards, for example), firms/investors (loans to large manufactures and trading firms) and businesses (energy, mining, manufacturing, etc.). Furthermore, the different sectors are related with each other and activity in one sector may lead/lag activity in other sectors. For instance, the housing sector boom/bust was one of the major causes of the Great Recession, dragging down other sectors with it. Another example was the recent plunge in oil prices which produced asymmetric economic outcomes for different sectors/regions, Figure 9. On one hand, we observed a slowdown in the mining and manufacturing sectors and, on the other, lower oil prices along with low interest rates were associated with robust auto sales and a shift toward light trucks (Figure 10). For XYZ, using big data can help predict how lines of business will react to different events—regions attached to the energy business may see disruptions in consumer business as well as lower mortgage originations along with a potential rise in delinquencies/bankruptcies. Similarly, investors involved in equity/commodities trading of energy-related stocks/oil/etc. may see some losses. Regions with less (or no) reliance on the energy sector may see the benefits of lower prices and XYZ can see more auto loans, and higher consumer spending on non-oil products, higher auto loans originations and potentially higher profits from trading activities related to auto/transportation industry.
For risk mangers/risk modeling, big data is a gold-mine that can improve risk assessment and management significantly. Two important components of risk modeling, in our view, are the microeconomic level (individual, sector and region specific information) and macroeconomic factors (overall economy—recession or expansion—external shocks—oil prices—interest rates, etc.). For effective risk modeling, an analyst needs to consider both micro and macro factors. Big data can help include both micro and macro factors in the models. Similar to the XYZ corporation example mentioned above, risk managers/modelers need to characterize risk for different regions, sectors and demographic groups. Big data (using individual information about income, job history, demographic and location) can help risk managers identify which group, sector, or region is more sensitive to a change in the economic outlook (higher inflation for example) and/or policy changes (such as tax changes).
Big Data Could Improve Methods to Measure Sector Activity
Many measures of economic activity (consumer confidence index, Figure 11, for example) are survey based. These surveys collect information from a relatively small number of respondents (some surveys only cover several thousand respondents).13 Since big data include information from a broader spectrum of the population, big data could help analysts measure the state of economic activities in a sector/region for different demographic groups more precisely. We have mentioned some examples of big data used to construct some indices such as MIT's price index and the Economic Policy Uncertainty Index, excellent examples of big data applications to measure the state of a sector.
The current employment situation report is one key sector level indicator, and is based on two surveys. Nonfarm payrolls employment is based on the Current Employment Statistics (CES) survey, also known as the establishment survey. BLS collects information from 147,000 businesses, a sample that includes around one third of total nonfarm employees. The unemployment rate is based on the Current Population Survey (CPS), also known as the household survey, and includes around 60 thousand households out of 124.6 million (as of 2015). The BLS does a good job of providing detailed information, such as unemployment rates by demographic grouping and MSA/state level. Still, big data could make significant improvements in this micro data by including more information from more businesses and households. For example, many businesses keep electronic records of employees and their hours worked/wages. If BLS had access to data like this, it could increase its sample size significantly. Similarly, millions of people use social media in the United States, and the BLS could use social media to collect data on household information. Basically, the BLS could utilize non-traditional tools in addition to traditional methods to include more information in the employment situation report.
Concluding Remarks: How to Bake the Big Data Cake?
Typically, decision makers' analysis starts with the data but, at present, the effect of big data on econometric modeling and decision making is limited. One major reason is that traditional econometric and statistical tools are unable to fully process big data. In our next report, we will discuss the limitations and solutions to utilizing big data in modeling and decision making. We readily recognize that there are other issues, such as privacy and cyber security concerns, that represent huge hurdles for the advancement of utilizing big data on a mass scale. We are not lawyers, IT or privacy experts, however, and as such we will solely focus on using big data for modeling and analysis from an economics perspective.
Author

Wells Fargo Research Team
Wells Fargo


