Bank stocks propel markets

USD: Mar '25 is Up at 109.000.
Energies: Mar '25 Crude is Down at 78.06.
Financials: The Mar '25 30 Year T-Bond is Down 9 ticks and trading at 112.08.
Indices: The Mar '25 S&P 500 emini ES contract is 36 ticks Lower and trading at 5998.00.
Gold: The Feb'25 Gold contract is trading Up at 2730.10.
Initial conclusion
This is not a correlated market. The USD is Down and Crude is Up which is normal, and the 30 Year T-Bond is trading Higher. The Financials should always correlate with the US dollar such that if the dollar is Higher, then the bonds should follow and vice-versa. The S&P is Higher and Crude is trading Higher which is not correlated. Gold is trading Higher which is correlated with the US dollar trading Down. I tend to believe that Gold has an inverse relationship with the US Dollar as when the US Dollar is down, Gold tends to rise in value and vice-versa. Think of it as a seesaw, when one is up the other should be down. I point this out to you to make you aware that when we don't have a correlated market, it means something is wrong. As traders you need to be aware of this and proceed with your eyes wide open. Asia traded Mixed. All of Europe is trading Higher.
Possible challenges to traders
-
Core Retail Sales is out at 8:30 AM EST. This is Major.
-
Retail Sales is out at 8:30 AM EST. This is Major.
-
Unemployment Claims is out at 8:30 AM EST. This is Major.
-
Philly Fed Mfg Index is out at 8:30 AM EST. This is Major.
-
Import Prices m/m is out at 8:30 AM EST. This is Major.
-
Business Inventories is out at 10 AM EST. This is Major.
-
NAHB Housing Market Index is out at 10 AM EST. This is Major.
-
Natural Gas Storage is out at 10:30 AM EST. This is Major.
-
FOMC Member Williams Speaks at 11 AM EST. This is Major.
Traders, please note that we've changed the Bond instrument from the 10 year (ZN) to the 2 year (ZT). They work exactly the same.
We've elected to switch gears a bit and show correlation between the 2-year Treasury notes (ZT) and the S&P futures contract. The YM contract is the Dow Jones Industrial Average, and the purpose is to show reverse correlation between the two instruments. Remember it's likened to a seesaw, when up goes up the other should go down and vice versa.
Yesterday the ZT migrated Lower at around 8:30 AM EST as soon as the CPI numbers were released. The Dow moved Higher at the same time. Look at the charts below and you'll see a pattern for both assets. The Dow moved Higher at 8:30 AM EST and the ZT moved Lower at around the same time. These charts represent the newest version of Bar Charts, and I've changed the timeframe to a 15-minute chart to display better. This represented a Short opportunity on the 2-year note, as a trader you could have netted 30 plus ticks per contract on this trade. Each tick is worth $7.625. Please note: the front month for ZT is now Mar '25 and the Dow is now Mar '25. I've changed the format to filled Candlesticks (not hollow) such that it may be more apparent and visible.
Charts courtesy of BarCharts
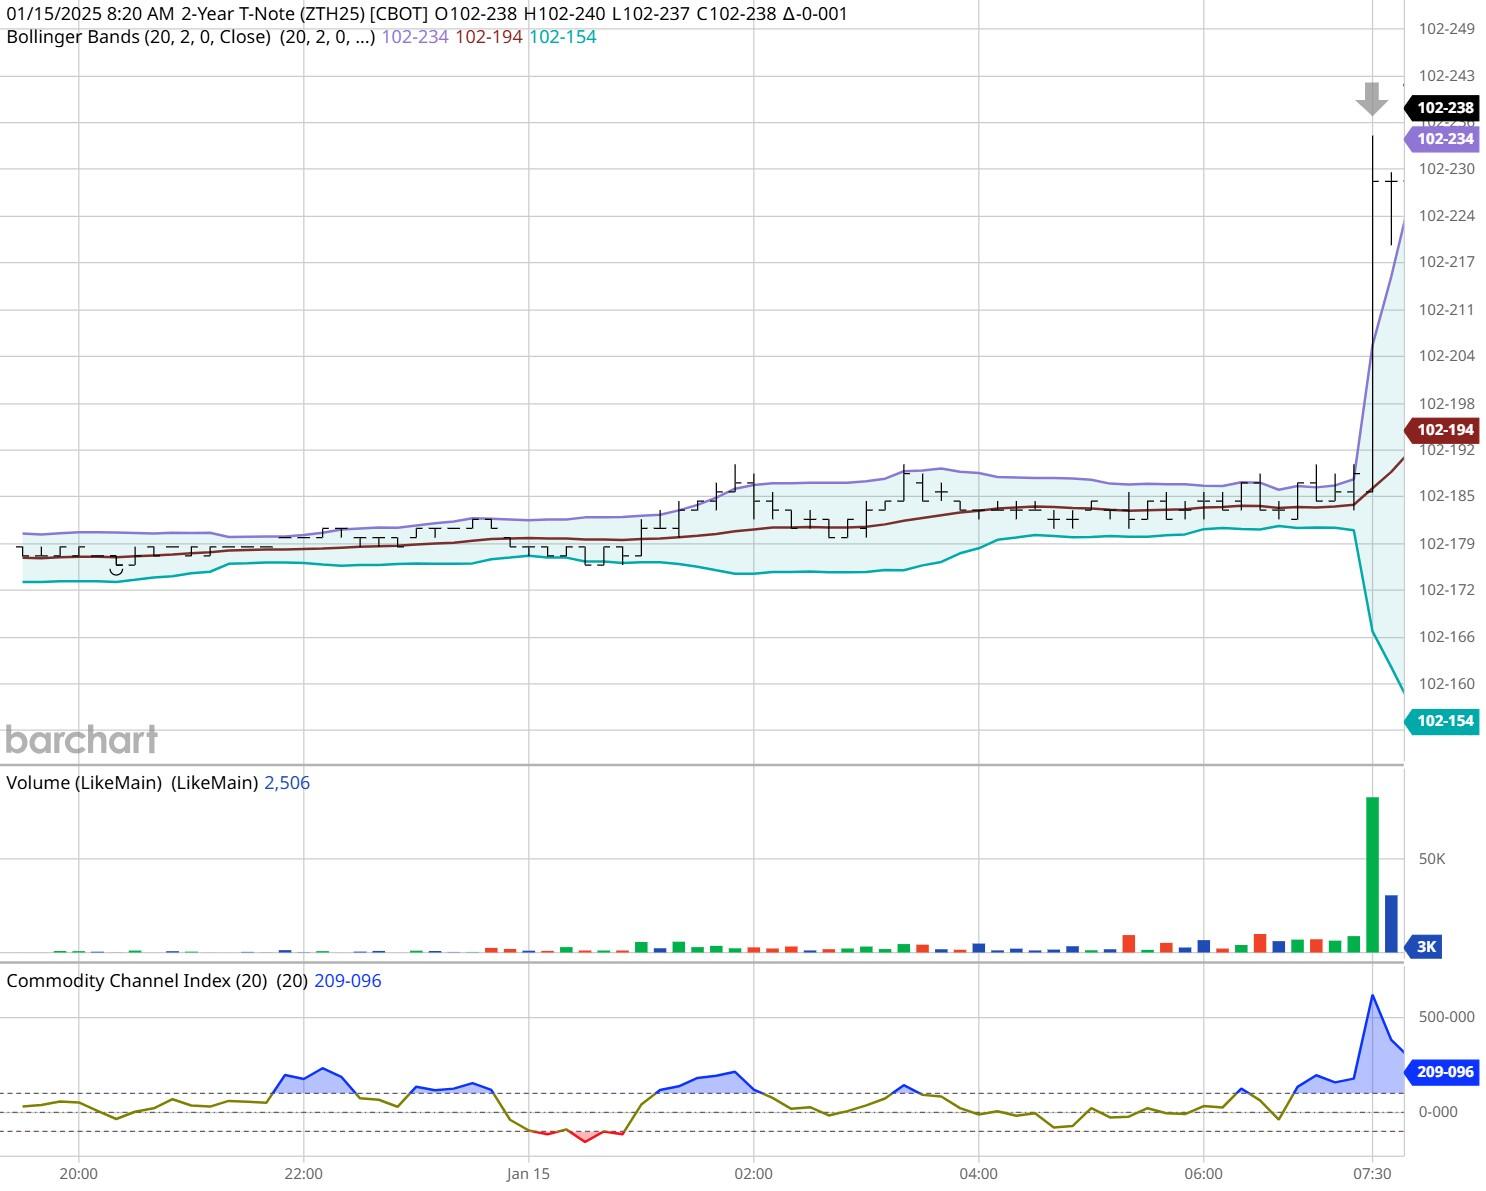
ZT -Mar 2025 - 1/15/25
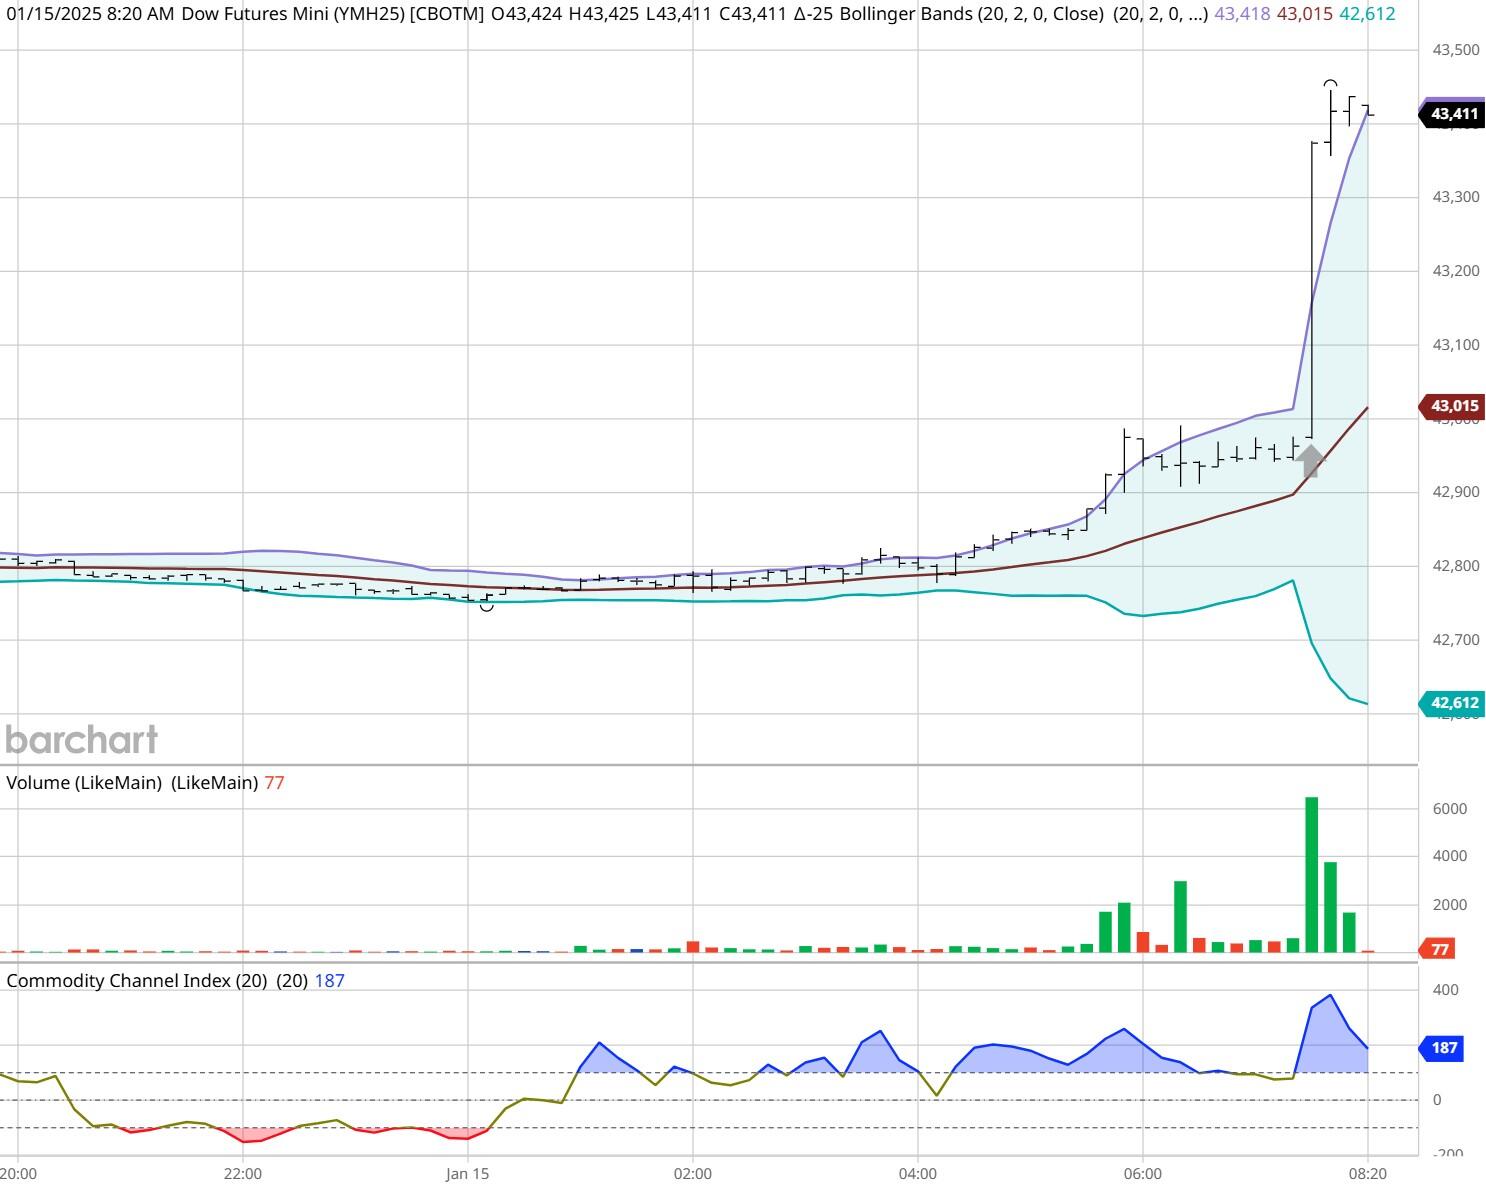
Dow - Mar 2025- 1/15/25
Bias
Yesterday we gave the markets a Neutral or Mixed market as we didn't see enough evidence for a Long bias. The Dow closed Higher by 703 points and the other indices closed Higher as well. Today we aren't dealing with a correlated market, and our bias is Neutral or Mixed.
Could this change? Of Course. Remember anything can happen in a volatile market.
Commentary
Yesterday we gave the markets a Neutral or Mixed bias as we didn't see enough evidence to commit to an Upside bias. The CPI numbers didn't really propel the markets forward but the bank stocks reporting quarterly earnings did. JP Morgan Chase, Citibank, Wells Fargo and others reported earnings that exceeded expectations and propelled the markets forward. Today we have Retail Sales numbers and that is always a market mover. Will it be enough to continue the market's upward trend? Only time will tell.
Author

Nick Mastrandrea
Market Tea Leaves


