Baidu Stock (BIDU) Ichimoku Cloud Analysis [Video]
![Baidu Stock (BIDU) Ichimoku Cloud Analysis [Video]](https://editorial.fxstreet.com/images/Markets/Equities/stock-certificates-11742678_XtraLarge.jpg)
The Baidu stock price broke above the daily Ichimoku cloud end of October 2019. Ichimoku Kinko Hyo strategy suggests we could see a temporary pullback towards the upper band of the cloud before further gains in the medium term. However, the pair has not yet completed the long-term double top bearish reversal chart pattern which suggests the Baidu stock price could drop to as low as $42.
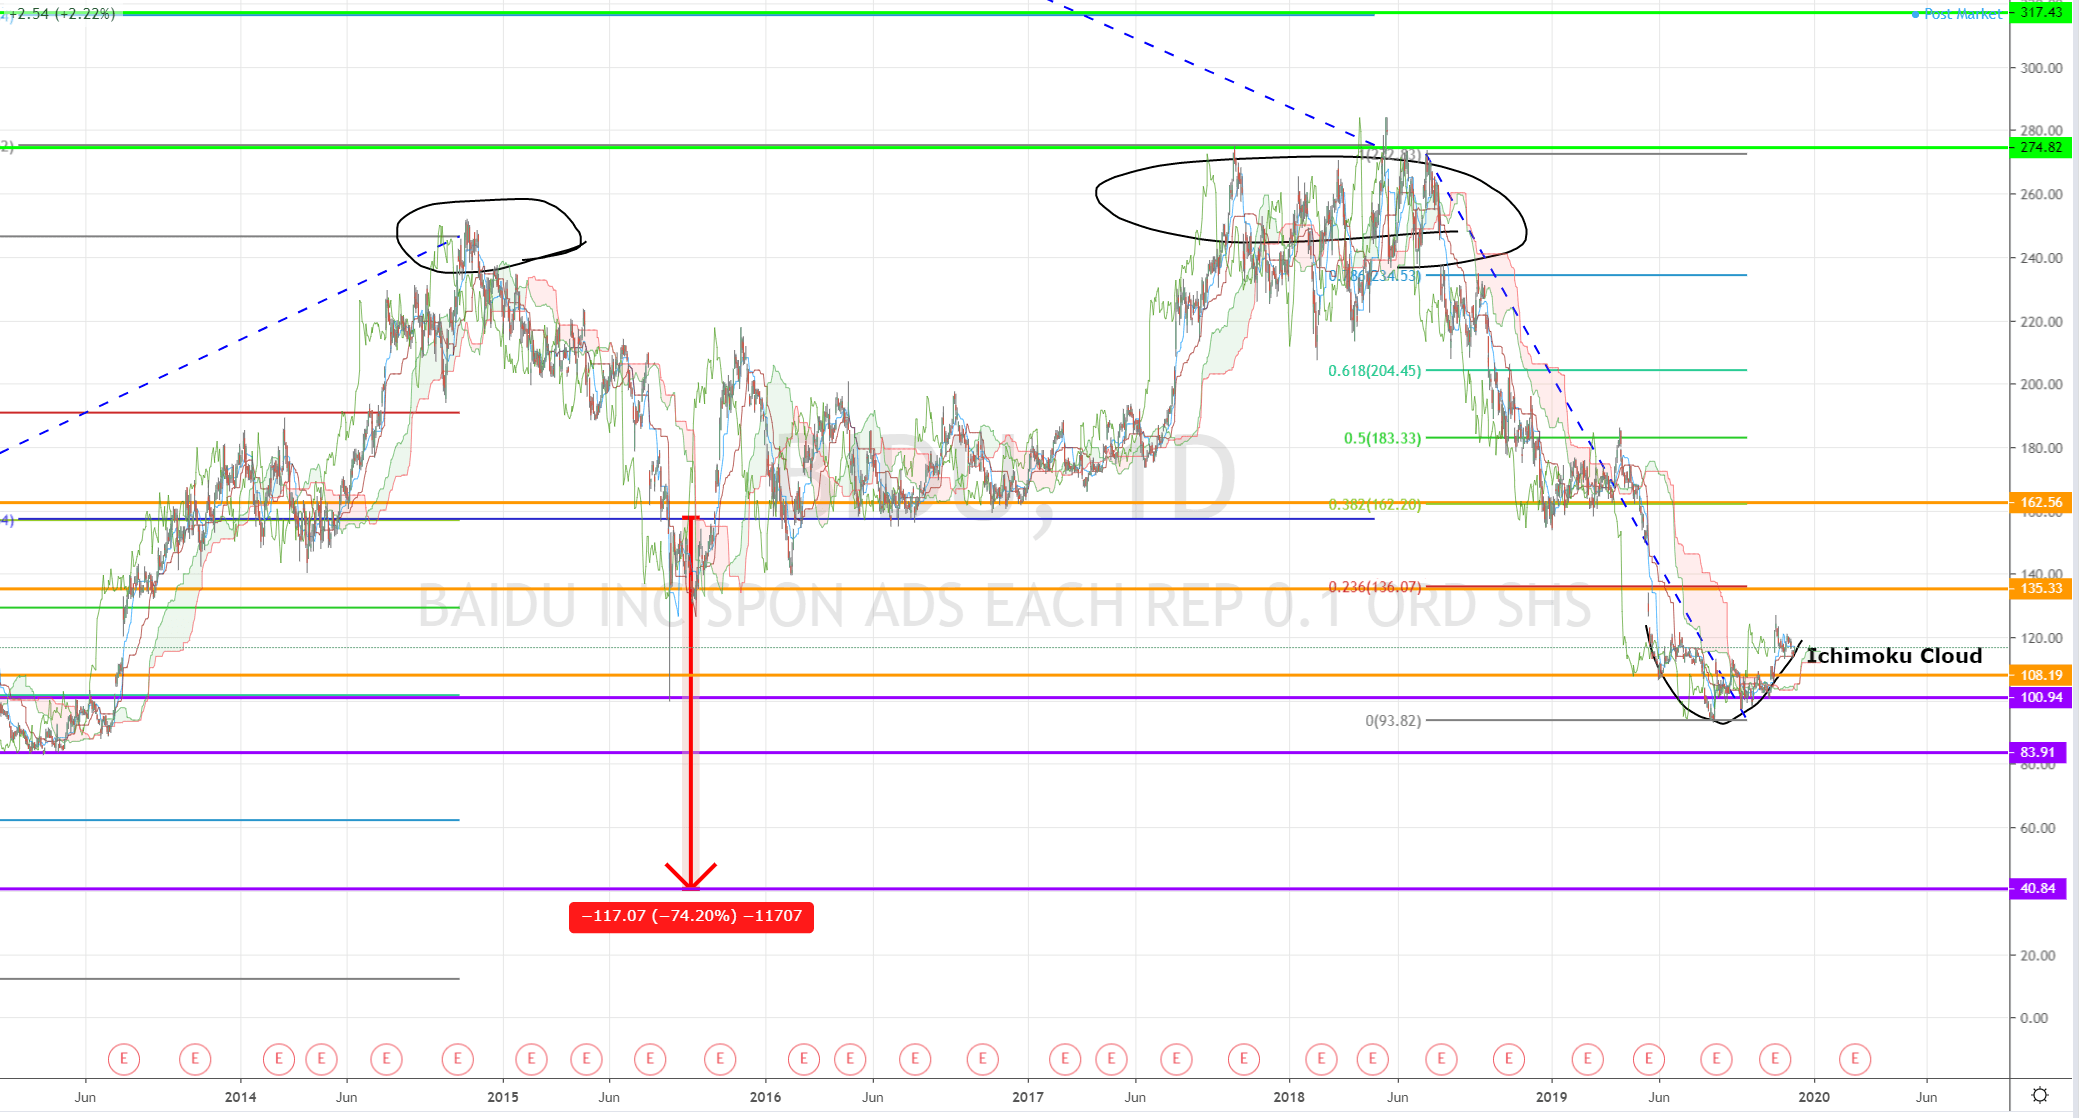
On the other hand, we also have a Saucer Bottom chart pattern forming on the daily chart.
Watch my Ichimoku cloud analysis for the Baidu stock in 2020 to see how I bring all points of the IDDA together.
For more from Invest Diva, click here
Author

Kiana Danial, CFP
Invest Diva
Kiana Danial is an award-winning, internationally recognized personal investing and wealth management expert.


