AUDUSD Forecast: Battling to retain the 0.6300 threshold

AUDUSD Current Price: 0.6303
- Australian Trade Balance posted a surplus of $A12.44 billion, growth-related figures were less encouraging.
- The greenback extended its rally after US Federal Reserve chair Powell’s hawkish message.
- AUDUSD battles to retain the 0.6300 mark after another round of quantitative tightening.
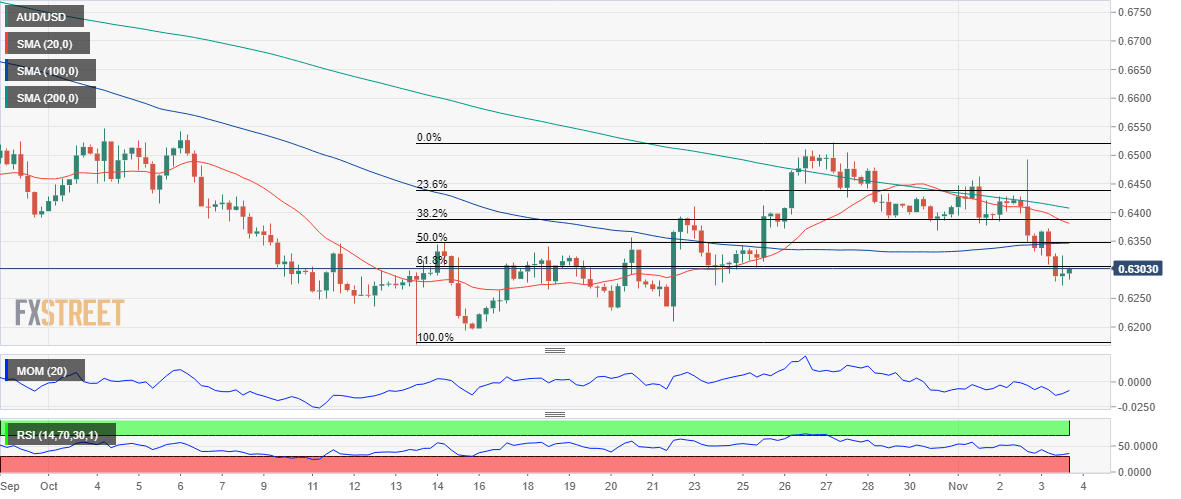
The AUDUSD pair trades around the 0.6300 level, not far from a fresh weekly high of 0.6271. The pair fell for a second consecutive day amid the broad dollar’s demand. The greenback maintained the strong momentum triggered by the US Federal Reserve, as the central bank hinted at more aggressive rate hikes in the docket. Chair Jerome Powell offered a quite hawkish message, signaling that the Fed needs to keep raising rates to a level sufficiently restrictive.
On Thursday, it was the turn of the Bank of England to announce its monetary policy decision. As widely anticipated, UK policymakers lifted the benchmark rate by 75 bps. However, the MPC painted quite a gloomy picture of the kingdom’s future, anticipating the recession will continue well into 2024. The greenback maintained its strength, partially losing it after Wall Street’s opening, as stocks trimmed most of their early losses, while US data failed to impress.
Australia published the S&P Global Services PMI, which was upwardly revised to 49.3 in October, lifting the Composite PMI to 49.8. The September Trade Balance posted a surplus of $A12.44 billion, much better than anticipated. On Friday, the RBA will publish the Monetary Policy Statement, while the country will also release Q3 Retail Sales, foreseen up by 0.4% in the quarter.
AUDUSD short-term technical outlook
The AUDUSD pair hovers around the 61.8% retracement of the daily run between 0.6169 and 0.6521 at 0.6303. Technical readings in the daily chart favor a bearish continuation, as the pair extended its decline below a firmly bearish 20 SMA, while the RSI indicator accelerated its decline and currently stands at around 41. The Momentum indicator, however, keeps seesawing within neutral levels.
In the near term, and according to the 4-hour chart, bears are in control. The pair is trading below all of its moving averages, with the 20 SMA gaining downward traction between the longer ones. The Momentum indicator retains a bearish slope at daily lows, while the RSI indicator consolidates around 36. A steeper decline could be expected on a break below 0.6270, toward the aforementioned year’s low.
Support levels: 0.6270 0.6230 0.6190
Resistance levels: 0.6380 0.6440 0.6495
Author

Valeria Bednarik
FXStreet
Valeria Bednarik was born and lives in Buenos Aires, Argentina. Her passion for math and numbers pushed her into studying economics in her younger years.















