AUD/USD: the C point pushing the price upside

AUD/USD has been bullish on the daily chart for quite a few days. After finding Double Bottom support, the price made a bullish move; consolidate and moved towards the upside. As of writing, the price is trading right at the level of resistance, where it had a rejection last time. Thus, the price is to make a big decision here. Today’s intraday price action has been bullish. If it continues being bullish and makes an upside breakout upon consolidation, it may head towards the North with good bullish momentum.
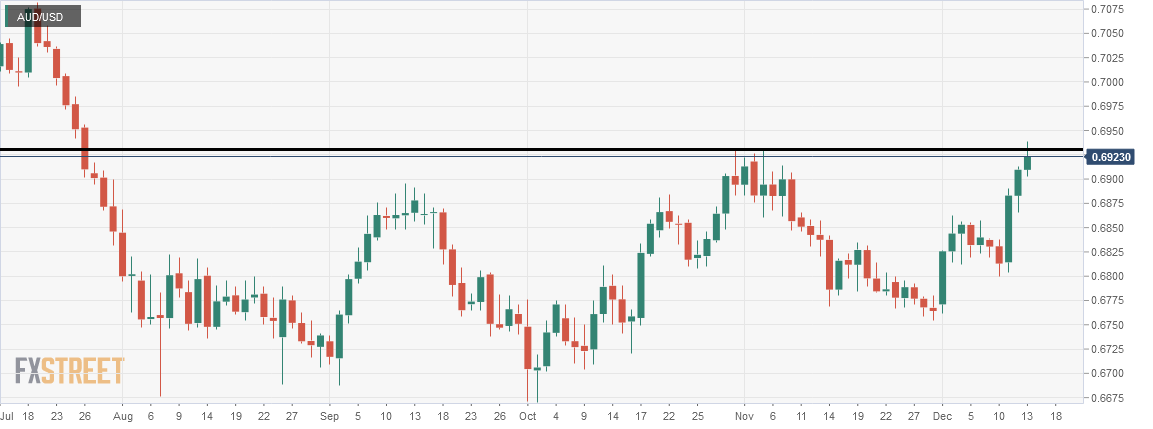
The chart shows that the price has been heading towards the North upon an ABC pattern on the daily chart. The last swing may be the resistance and push the price down. However, two consecutive bullish candles at the C point suggest that the bull is strong enough to make a breakout here. If the price breaches the level, the buyers may keep holding their previous long positions and add more to it. The H4 chart is going to play a significant role in attracting daily buyers to look for a long opportunity. Let us now have a look at how the H4 chart looks.

The H4 chart looks very bullish, as it produced a Hammer right at the daily resistance. It may make the price consolidate. Upon finding support and producing an H4 bullish reversal candle, if it breaches today’s highest high, it may head towards the level of 1.70000. The price may find its support at the level of 0.69000. If it breaches the level of 0.6900, on the other hand, it may head towards the South relatively with less selling pressure.
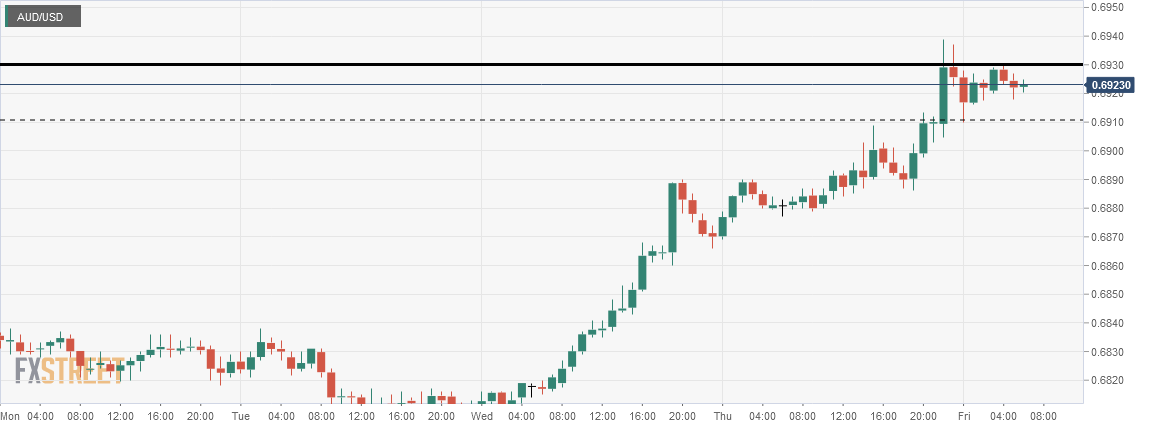
The H1 chart shows the price is about to produce a Double Top. The neckline is at the level of 0.6910. If the price makes a breakout at the neckline, it may consolidate around the level before making the next bearish move. The level of 0.6900 is H4 support. Thus the H1 traders may want to wait for an H1 breakout at that level to go short. The fact remains, if it makes an upside breakout, the traders may go long aggressively since there is much space for the price to travel.
The daily and the H4 chart looks bullish. The H1 chart looks a bit bullish biased, but it may get bearish as well. In a nutshell, the AUDUSD buyers have the upper hand.
Author

EagleFX Team
EagleFX
EagleFX Team is an international group of market analysts with skills in fundamental and technical analysis, applying several methods to assess the state and likelihood of price movements on Forex, Commodities, Indices, Metals and


