AUD/USD Forecast: Eyes on RBA monetary policy decision

AUD/USD Current Price: 0.6800
- Australian data was generally encouraging but not enough to underpin the aussie.
- The Reserve Bank of Australia is expected to hike the cash rate by 50 bps.
- AUD/USD is technically bearish and en route to testing this year's low at 0.6680.
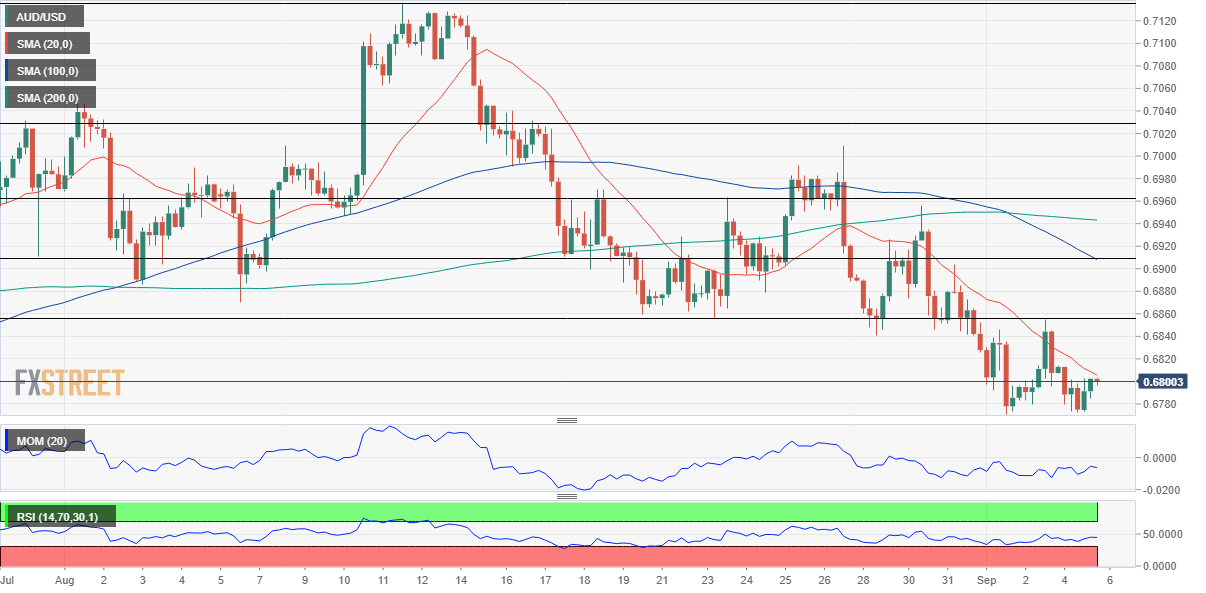
The AUD/USD pair fell to 0.6772 on Monday, as the greenback started the week with a firm footing. The pair recovered some ground during London trading hours but stood around 0.6800 early Tuesday, with low volumes across the FX board amid a holiday in the US.
The pair fell despite mostly encouraging Australian data. The AIG Performance of Construction Index printed at 47.9 in August, improving from 45.3 in July but still indicating contraction in the sector. The August S&P Global Services PMI was upwardly revised from 49.6 to 50.2, while the Composite PMI was also revised to 47.9. Furthermore, TD Securities Inflation declined by 0.5% MoM in August, while the yearly figure contracted from 5.4% to 4.9%.
The Reserve Bank of Australia will announce its decision on monetary policy early on Tuesday. Market participants are waiting for a fourth consecutive 50 bps hike, which will send the cash rate to 2.35%. However, the focus will be on any hint of future movements, as investors speculate the central bank will soon have to slow the pace of quantitative tightening, given its effects on consumer sentiment and house prices. The RBA may not be as willing as the US Federal Reserve to tame inflation at any cost.
AUD/USD short-term technical outlook
The daily chart for the AUD/USD pair shows that the pair managed to post some intraday gains but also that it fell to a lower low, which skews the risk to the downside. In the mentioned time frame, technical indicators stand directionless within negative levels, as the pair develops below firmly bearish moving averages.
In the near term, and according to the 4-hour chart, the risk is also skewed to the downside. The pair cannot advance beyond a bearish 20 SMA, hovering a handful of pips above the current level while below the longer ones. Technical indicators, at the same time, remain directionless below their midlines. The pair has a solid static resistance level at 0.6855, the 61.8% retracement of the latest bullish run, and bears will retain control as long as it holds below it.
Support levels: 0.6770 0.6720 0.6680
Resistance levels: 0.6855 0.6890 0.6925
Author

Valeria Bednarik
FXStreet
Valeria Bednarik was born and lives in Buenos Aires, Argentina. Her passion for math and numbers pushed her into studying economics in her younger years.